
RADARSAT-1 applications
The many advances in RADARSAT-1 technology were developed to respond to specific needs for radar data in hundreds of environmental monitoring applications in Canada and around the world. This is an overview of the main RADARSAT-1 Earth observation data applications.
Ice monitoring
RADARSAT data © Canadian Space Agency, . Received by the Canada Centre for Remote Sensing. Processed and distributed by MacDonald, Dettwiler and Associates Ltd.
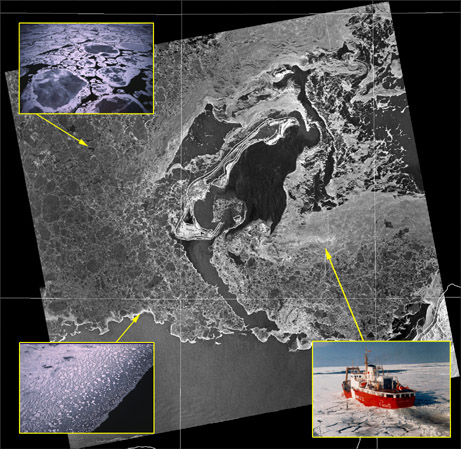
RADARSAT-1 provided routine surveillance of the entire Arctic region. This helped track sea ice distribution, identify various types of ice, and produce daily ice charts. The information was used for planning safe shipping routes and supply operations for offshore exploration platforms or ocean research stations. RADARSAT-1 also helped update maps of Antarctica and monitor Antarctic ice fields.
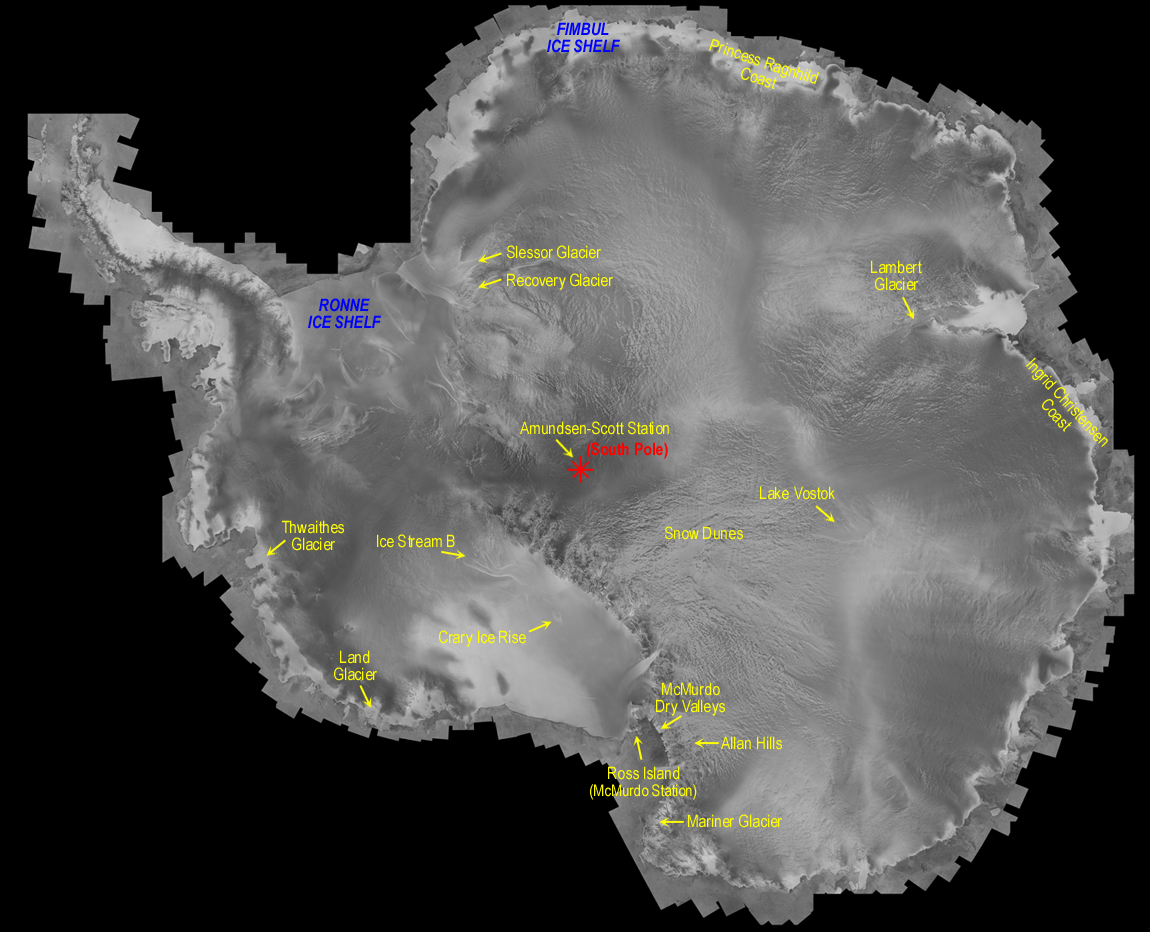
Text version - graphic about the first complete and uniform mosaic of Antarctica created from radar synthetic aperture
Fimbul ice shelf
- Princess Ragnhild Coast
- Lambert Glacier
- Ingrid Christensen Coast
- Mariner Glacier
- Ross Island (McMurdo Station)
- Allan Hills
- McMurdo Dry Valleys
- Crary Ice Rise
- Land Glacier
- Thwaithes Glacier
- Ice Stream B
Ronne ice shelf
- Slessor Glacier
- Recovery Glacier
Amundsen-Scott Station (South Pole)
- Lake Vostok
- Snow Dunes
RADARSAT data © Canadian Space Agency, . Received and processed by the Alaska Synthetic Aperture Radar (SAR) Facility. Mosaic prepared by the Byrd Polar Research Center of Ohio State University. Project sponsored by NASA.
The above figure is a low-resolution version of the first seamless mosaic of Antarctica, which was compiled from SAR images. They were acquired by RADARSAT-1 between and as part of the Antarctic mapping mission, a collaboration between the Alaska SAR Facility, the Byrd Polar Research Center of Ohio State University, NASA and the Canadian Space Agency to completely map the Antarctic with RADARSAT-1.
Environmental monitoring
RADARSAT data © Canadian Space Agency, . Received by the Canada Centre for Remote Sensing. Processed and distributed by MacDonald, Dettwiler and Associates Ltd.
Because RADARSAT-1's SAR penetrated heavy cloud cover, many of the world's rain forests and coastal regions could be mapped effectively. RADARSAT-1 could also monitor the extent of marine oil spills, providing vital information for spill control and clean-up operations, and had considerable value in settling legal questions related to oil spills.
Disaster management
Radar satellites are key resources in a variety of disaster management scenarios. The coordination of international satellite resources for disaster response efforts is managed by the International Charter: Space and Major Disasters, of which Canada is a founding member and data contributor.
The data has been used effectively to respond to disasters such as earthquakes, tsunamis, floods, landslides, wildfires, and other natural or technological disasters. The ability to deliver data in near real time is essential for relief operations to map and monitor damage and for assessing the impact on the future. Even today, RADARSAT-1 images are still used to map and compare areas affected by disasters.
Hydrology

RADARSAT-1 provided excellent land/water delineation. In this image, the forest cover and floodplain appear in tones of grey, while the water is distinctly black. RADARSAT data © Canadian Space Agency, . Received by the Canada Centre for Remote Sensing. Processed and distributed by MacDonald, Dettwiler and Associates Ltd.
Many applications were developed to take advantage of RADARSAT-1's capacity to detect the presence of water. These included monitoring flooding and the build-up of river ice, and tracking the melting of snow-covered areas.
For example, the forests along the Amazon River and nearby lakes in Brazil experience seasonal flooding. By mapping these areas over time using RADARSAT-1 imagery, it has been possible to assess the impacts, predict the extent and duration of floodwaters, analyze the environmental consequences of water diversion projects, and develop flood mitigation measures.
Geology
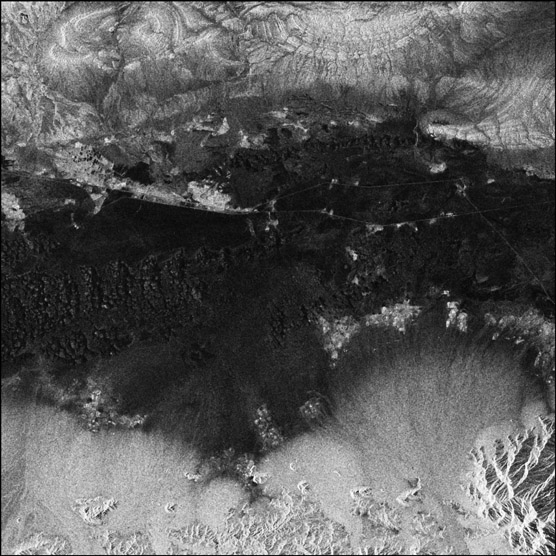
The many alluvial fans in the Balochistan Desert in southwestern Pakistan show in very light tones in the lower part of this RADARSAT-1 image. The dark area is the structural depression that separates the Chagai Hills from the Ras Koh Range. Wet flood plains and areas covered with thin layers of salt also have a dark appearance. RADARSAT data © Canadian Space Agency, . Received by the Canada Centre for Remote Sensing. Processed and distributed by MacDonald, Dettwiler and Associates Ltd.
Many significant geological structural features were mapped using RADARSAT-1. By mapping features such as faults, folds, and lineaments we obtained new information on groundwater distribution, economic mineral deposits, and the potential for oil and gas deposits. RADARSAT-1 imagery also helped to identify appropriate sites for hazardous waste. In addition, seismic and fault data from RADARSAT-1 imagery was used for studies on the nature and causes of earthquakes.
Agriculture

This RADARSAT-1 image of Zhaoqing, China, is an integration of standard and fine beam mode images. The colours show different types of vegetation and various crop growth stages. Aquaculture sites and flooded rice paddies appear as very dark and black, while the city areas and banana fields are very light coloured. RADARSAT data © Canadian Space Agency, . Received by the Canada Centre for Remote Sensing. Processed and distributed by MacDonald, Dettwiler and Associates Ltd.
Using RADARSAT-1 imagery, agricultural planners could examine and assess crop characteristics and planting practices and could better forecast crop yields. Under favourable conditions, soil characteristics such as moisture content and surface roughness could be identified. These helped determine crop conditions, susceptibility to erosion, and irrigation needs.
Forestry
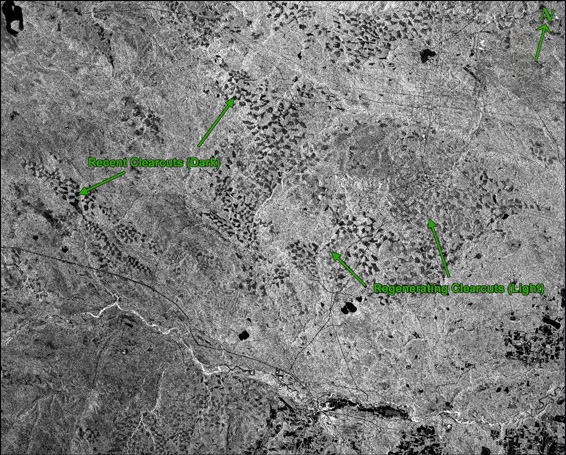
Text version - graphic about forestry
RADARSAT imagery of the forestry
- Recent clearcuts (dark)
- Regenerating clearcuts (light)
This RADARSAT-1 image of Whitecourt, Alberta, shows the extensive clearcutting of boreal forest that has occurred in this region. Recent clearcuts are quite visible as dark areas, while regenerating clearcuts, seen as grey tones, are harder to distinguish from the light tones of the remaining boreal forest. RADARSAT data © Canadian Space Agency, . Received by the Canada Centre for Remote Sensing. Processed and distributed by MacDonald, Dettwiler and Associates Ltd.
RADARSAT-1 provided valuable data to help map and monitor the world's forests. Using these data, accurate maps of clear cuts in boreal and tropical forests could be created to assess environmental impacts and measure the success of replanting operations.
Coastal waters and open oceans
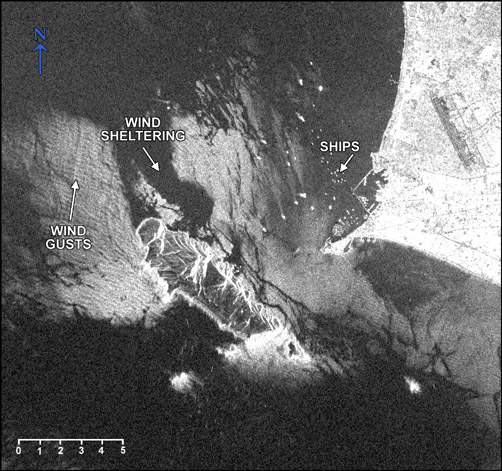
Text version - graphic about coastal waters and open oceans
RADARSAT imagery of the coastal waters and open oceans
- Cardinal points - North
- Wind gusts wind shelterring
- Ships
- Map scale
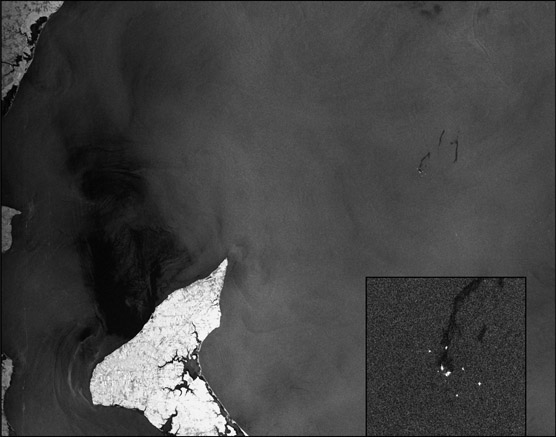
The dark tones in this RADARSAT-1 image, captured off the coast of Callao, Peru, are due to the decreased surface roughness by the wind lee effects. The lighter patches show where the wind has increased the surface roughness of the water. Ships appear as very bright spots in this image. RADARSAT data © Canadian Space Agency, . Received by the Canada Centre for Remote Sensing. Processed and distributed by MacDonald, Dettwiler and Associates Ltd.
RADARSAT-1 was an important source of new data for the world's oceans and coastal regions. Regardless of cloud, fog, or darkness, RADARSAT-1 could accurately measure changes in ocean waves and winds — information that was useful for offshore oil exploration, ocean research operations, and locating potentially productive fishing areas.