
In images – The RADARSAT Constellation Mission captures its millionth image of Earth

The three satellites of the RADARSAT Constellation Mission (RCM), which have been orbiting some 600 km from our planet since , overlook Canada and the Arctic's vast territory and maritime approaches. The RCM captured its one millionth image of Earth on , an accomplishment that attests to the importance and growing use of satellite Earth observation data to study and protect our planet and adapt to climate change.
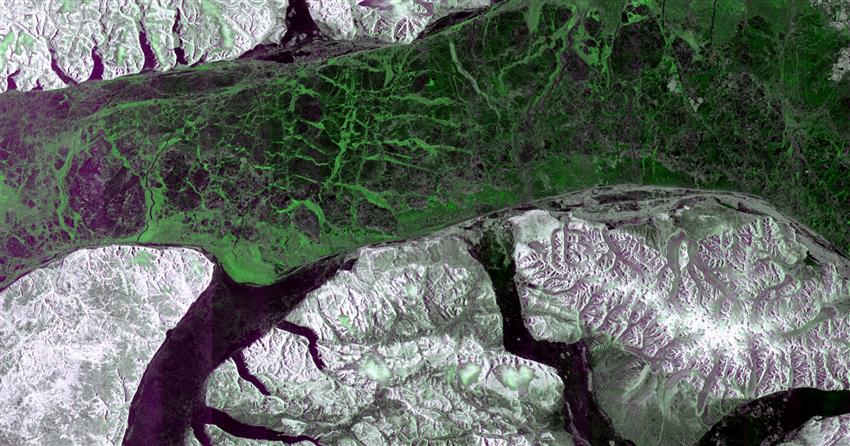
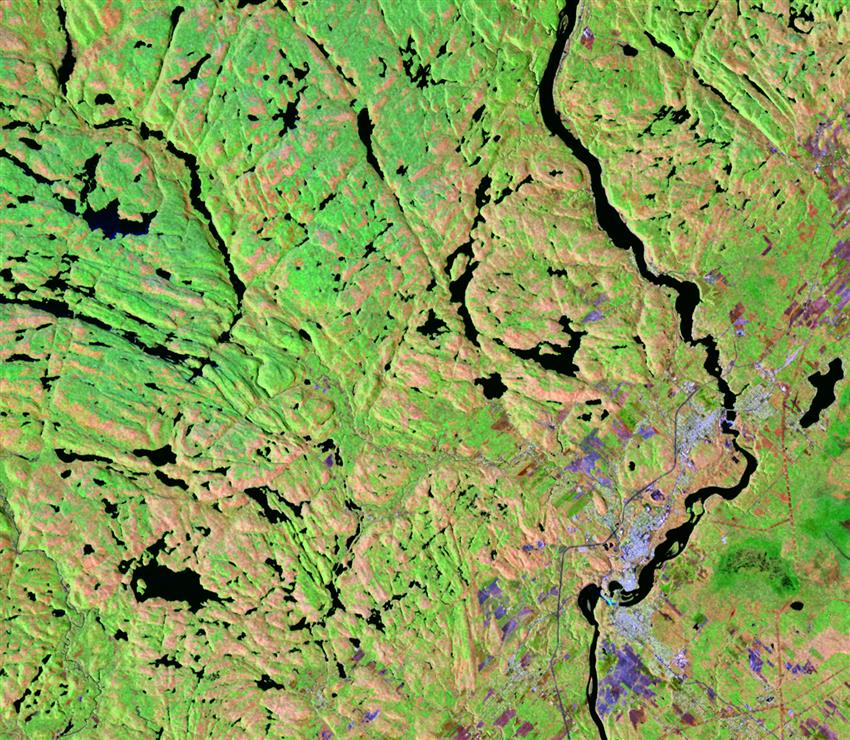
The RCM one millionth image, acquired on . This image of the Canadian Arctic shows the tip of Borden Peninsula and Brodeur Peninsula, on Baffin Island, as well as Devon Island in Nunavut. (Credit: RADARSAT Constellation Mission imagery © Government of Canada [2023]. RADARSAT is an official mark of the Canadian Space Agency)
The RCM is the most recent mission in the RADARSAT program, which began in with the launch of RADARSAT-1. RADARSAT satellites are equipped with powerful synthetic aperture radars that transmit and receive microwaves to produce high-quality images of Earth. They have the advantage of being able to scan Earth day and night and in all weather conditions, in addition to being particularly efficient in monitoring water and soil moisture. Canada has developed world-renowned expertise in radar technology.
RCM data is used by more than ten federal departments to provide services to Canadians in areas such as maritime surveillance, disaster management and ecosystem monitoring. To illustrate the many ways in which this benefits our lives, here are a few colourized images from the RCM.
Floods
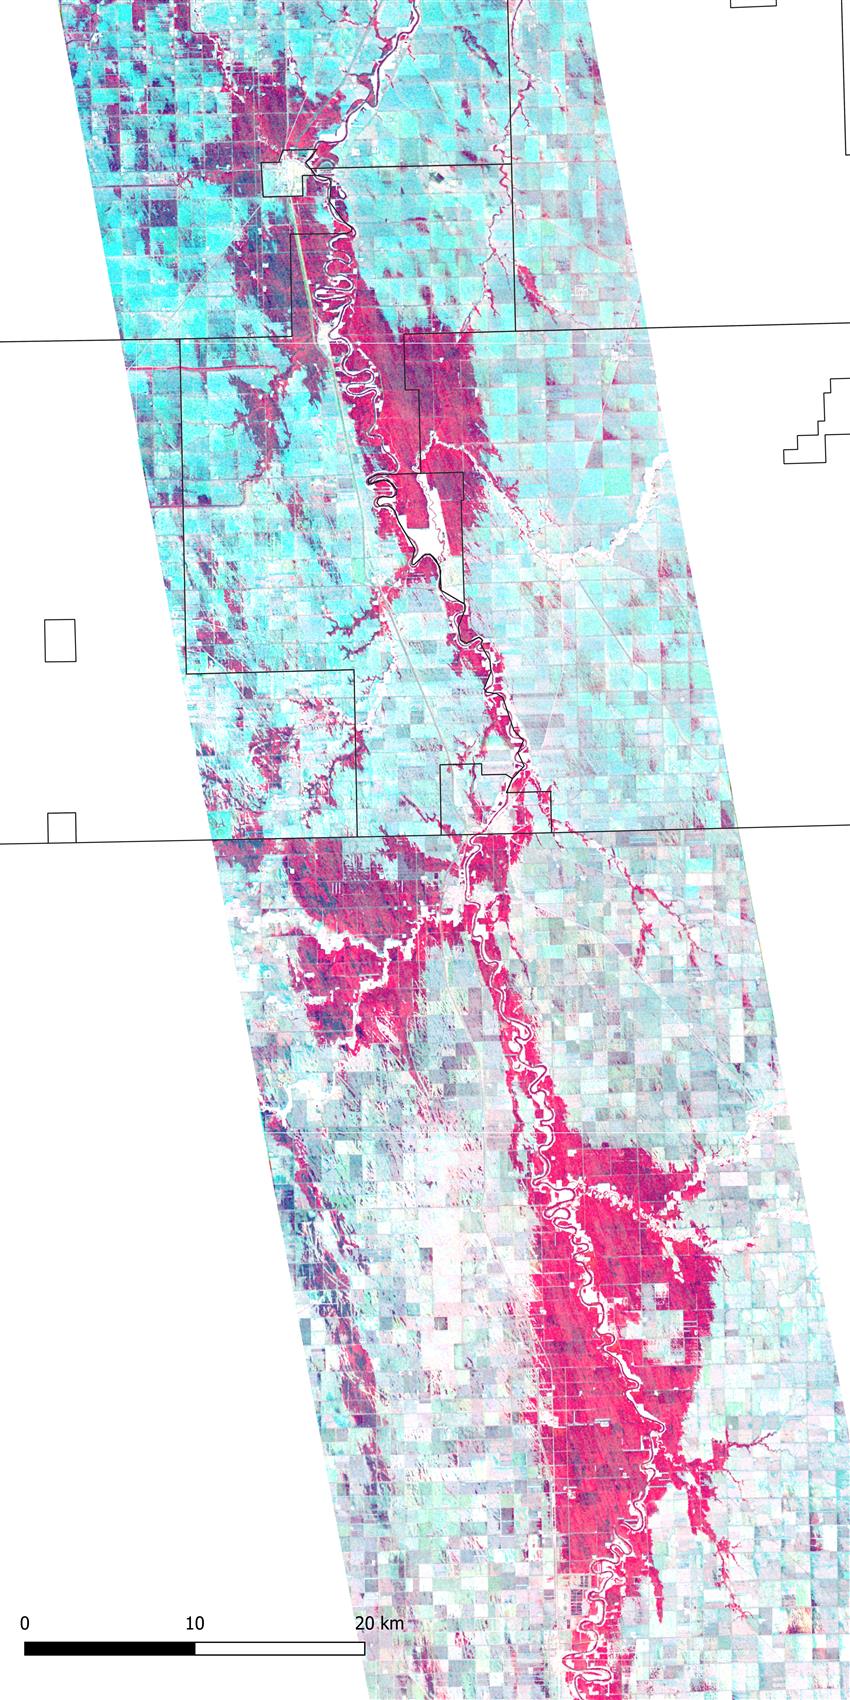
Image produced using data from the RCM shows the areas flooded by the Red River Flood in . Turquoise squares show agricultural fields and pink squares show flooding areas. (Credit: RADARSAT Constellation Mission imagery © Government of Canada []. RADARSAT is an official mark of the Canadian Space Agency. Data processed by Dromadaire Géo-Innovations)
This image produced using data from the RCM shows the areas flooded by the Red River Flood in . It shows the area surrounding the town of Morris, Manitoba, which was particularly affected by the flooding.
The Red River runs from south to north. It serves as the border between North Dakota and Minnesota in the United States, all the way up to Manitoba in Canada. It has been subject to recurring floods. The situation became concerning in spring , both in the United States and Canada, because of late snowfalls and a quick thaw.
RCM data is used by public safety officials to facilitate flood predictions, response activities in affected areas and restoration of those areas.
Agriculture
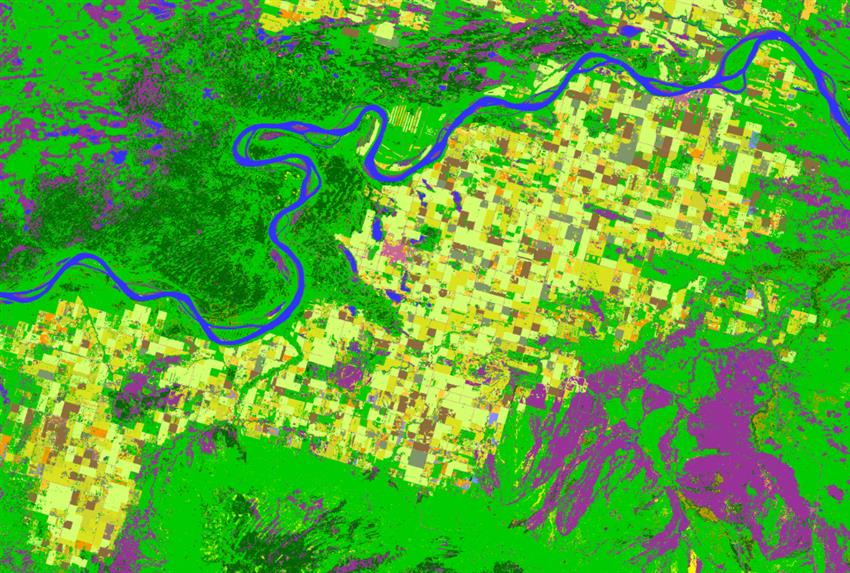
Image produced using data from the RCM that shows an agricultural area in Alberta. The different types of crops are in shades of yellow and brown, while forests and wetlands are in green and purple. (Credit: RADARSAT Constellation Mission imagery © Government of Canada []. RADARSAT is an official mark of the Canadian Space Agency. Data processed by Agriculture and Agri-Food Canada)
Understanding the state and trends in agricultural production is essential to combat threats to agricultural production and to ensure profitability in the sector. The Earth Observation Team of the Science and Technology Branch at Agriculture and Agri-Food Canada began the process of generating annual crop inventory digital maps, namely by using RCM data. This image shows an agricultural area in Alberta, its different types of crops (shades of yellow and brown), which are distinct from the forests and wetlands. Satellite imagery can be used to estimate the condition of crops and to determine the amount of cropland and the type of crop (e.g. wheat, barley, soybean) as well as the volume that will be produced, for example. Farmers and agronomists use these maps to assess soil and crop properties, and to inform their actions to optimize crop yield and farm sustainability.
Ice
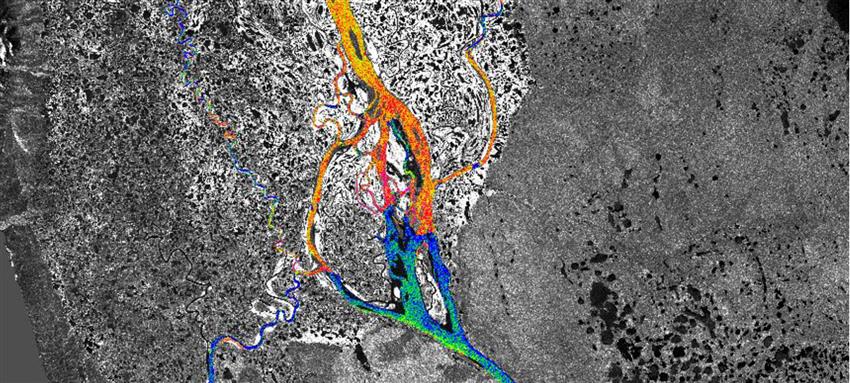
Satellite image produced using data from the RCM that shows the Mackenzie River, in the Northwest Territories. Each colour in the image represents the different states of water. (Credit: RADARSAT Constellation Mission imagery © Government of Canada []. RADARSAT is an official mark of the Canadian Space Agency. Data processed by Natural Resources Canada)
This image of the Mackenzie River, in the Northwest Territories, taken on , shows the presence of ice. Open water is illustrated in blue; smooth ice is in green. Orange, red and pink represent consolidated ice varying from rough to very rough. Ice jams are formed in the red and pink sections of the river.
Natural Resources Canada's Emergency Geomatics Service uses satellite imagery to actively monitor ice break-up and flooding in the spring to generate maps showing ice conditions and flooded areas to support emergency response operations across Canada.
RCM data helps ensure safe and efficient navigation through sea ice by providing information on ice quality, density and resistance as well as on the ice formation cycle. It supports the commercial maritime sector in Canada.
Biodiversity and wetlands
Satellite image that shows La Mauricie National Park in Quebec, Canada. A river and many lakes are in black, coniferous forests are in green and the deciduous forests are in beige. A town is located along the river, towards the bottom. (Credit: RADARSAT Constellation Mission imagery © Government of Canada []. RADARSAT is an official mark of the Canadian Space Agency. Data processed by Dromadaire Géo-Innovations. Landsat 8 image courtesy of the U.S. Geological Survey. Contains modified data from the Sentinel-1 mission from ESA's Copernicus initiative)
La Mauricie National Park is located on the edge of the Canadian Shield, which is characterized here by rounded terrain and dotted with numerous lakes. This product is composed of three images. The colours from the Landsat image in the visible spectrum acquired on , were combined with two radar images, one from the RCM captured on , and another from Sentinel-1 taken on . The result makes it easier to discern the contours of the terrain features. Because it is spring and leaves are beginning to grow, it is possible to differentiate coniferous forests (in green) from deciduous forests (light brown).
There are also hundreds of lakes in black. Radar technology is particularly useful for monitoring lakes and wetlands. Wetlands have many benefits, including absorbing the impact of large waves or floods; filtering residues and toxic elements; supplying food and vital habitat for many wildlife species; and providing us with sources of food, energy and materials. In order to conserve and carefully use the resources available in wetlands, it is necessary to map and classify them. The RCM provides data to the Canadian Wetland Inventory.
Change detection
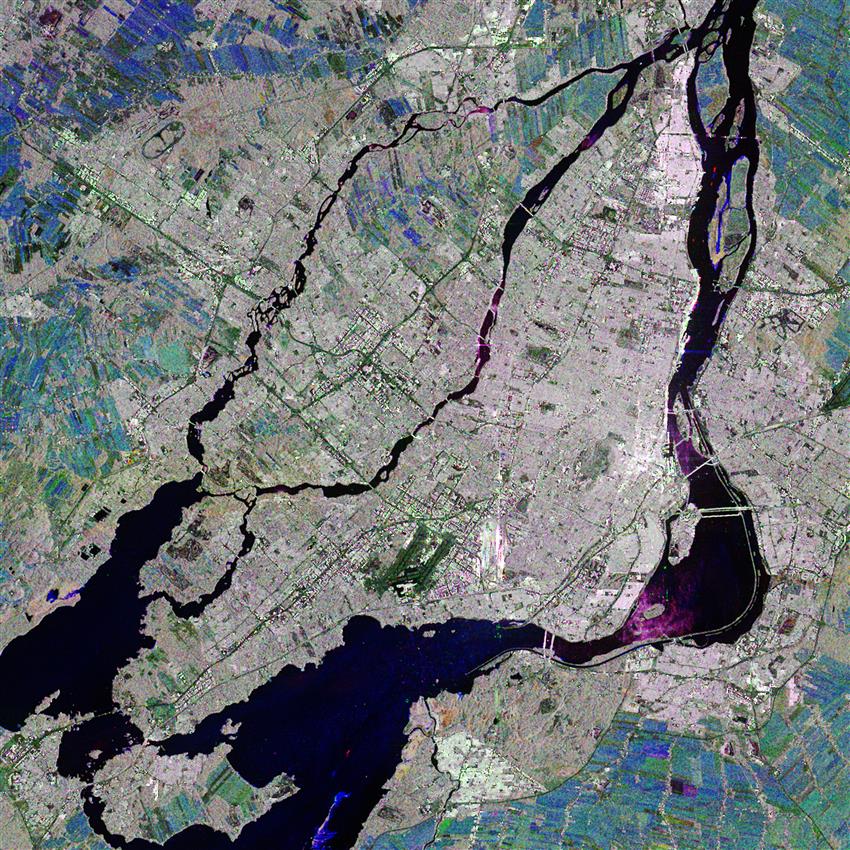
Text version - Greater Montreal region
Satellite image of the Greater Montreal region. The image shows the Island of Montreal and Laval, as well as the Lower Laurentians (north of Laval) and part of the Montérégie region (south of Montreal).
Each colour in the image represents different geographical features.
- Dark colours: smooth surfaces (water, highways, airports runways)
- Pale and grey: developed areas (downtown and the suburbs)
- Brown and green tints: forested areas
- Blue-green: farmland
Satellite image of the Greater Montreal region. The image shows the Island of Montreal and Laval, as well as the Lower Laurentians (north of Laval) and part of the Montérégie region (south of Montreal). (Credit: RADARSAT Constellation Mission imagery © Government of Canada []. RADARSAT is an official mark of the Canadian Space Agency. Data processed by Effigis)
This map of the Greater Montreal Area is composed of several images from the RCM captured on different dates, which make it possible to detect changes in the soil. The coloured areas illustrate changes in agricultural areas due to crop growth.
By frequently capturing images of one area, the RCM makes it possible to detect changes across various fields of application: floods, droughts, movement of infrastructure, ground freeze/thaw, ground sinking, etc.