
State of the Canadian Space Sector Report
Facts and Figures
On this page

© Her Majesty the Queen in Right of Canada, as represented by the Minister of Innovation, Science and Industry, .
ISSN: 2369-6338
About this Report
In this section
Objective
The State of the Canadian Space Sector Report provides factual information about the Canadian space sector. The report, which is now in its 22nd edition, is based on a questionnaire sent to companies, not-for-profit organizations, research centres and universities with space-related activities in Canada. This year's report is based on data from 174 organizations.
To align with international practices, the publication is identified by the year in which the survey took place (), but will report on data covering the year .
The report includes data on the number of organizations active in the sector and their composition, the sectors of activity, the Canadian space workforce and its composition, research and development (R&D), and innovation. In this edition, data on economic trends are reported for the – period. Readers should consult previous editions (available on the Canadian Space Agency website or the Government of Canada Open Government portal) for information regarding results prior to .
The organization-specific information used to compile this report remains strictly confidential and will not be released in any manner other than aggregate form. Consequently, in certain circumstances, a detailed explanation or in-depth reporting of the results cannot be provided in order to protect the confidentiality of the respondents.
Of note, the numbers presented throughout the report may not add up precisely to the totals provided due to rounding.
About the Authors
Policy Branch
This report is produced by the Economic Analysis and Research Team, Policy Branch, at the Canadian Space Agency (CSA).
Contact
- David Haight, Chief Economist, david.haight@canada.ca
- Gaëlle Bourgoin, Analyst, gaelle.bourgoin@canada.ca
Please send media inquiries to CSA Communications, 450-926-4370, ASC.Medias-Media.CSA@canada.ca.
For More Information
For more information about the Canadian space sector, or for an electronic copy of this report, please go to www.asc-csa.gc.ca/eng/publications.
Acknowledgments
The CSA wishes to acknowledge all those who responded to the questionnaire. Without them, this report would not have been possible.
President's Message

Sylvain Laporte,
President of the Canadian Space Agency (CSA)
As the President of the Canadian Space Agency (CSA), I am honoured to present the State of the Canadian Space Sector Report: Facts and Figures . The report, which we have been publishing since , is the primary reference on the Canadian space sector. It contributes to our understanding of the sector by providing comprehensive and authoritative data, as well as long-term trend analysis on the economic activity generated in the Canadian space sector.
The State of the Canadian Space Sector Report: Facts and Figures is based on information gathered from over 174 organizations involved in space activities from across Canada, including small businesses, multinational space companies, not-for-profit organizations, research centres and universities.
In , the space sector produced revenues of $5.7B and contributed $2.5B to Canada's gross domestic product (GDP). Research and development (R&D) expenditures reached a total of $356M, while commercialization revenues from government-funded projects totalled $283M. Space sector organizations reported a total of 170 inventions and 53 registered patents.
The Canadian space workforce remained at nearly 10,000 jobs, while activities in the space sector supported close to 11,000 additional jobs in the wider Canadian economy. This year, the CSA made changes to its definition of highly qualified personnel and added a new indicator to measure the STEM workforce (which includes employees with occupations related to science, technology, engineering and mathematics), in order to be more aligned with Statistics Canada's and the Organization for Economic Co-operation and Development's (OECD) definitions.
I trust you will find this publication useful. I would like to convey my gratitude to all those who contributed to the survey. This publication would not be possible without the generous collaboration of members of the Canadian space industry and academia.
1. Executive Summary
In , total revenues in the Canadian space sector remained stable at $5.7B. The average annual growth rate of the space sector between and was 1.3%. The space sector was estimated to have contributed $2.5B to Canada's GDP and supported a total of 20,891 jobs in the greater Canadian economy (including space sector jobs, supply industry jobs and jobs created as a result of consumer spending).
In , the upstream segment accounted for $812M in revenues, while the downstream segment accounted for the majority of revenues, at $4.9B. Of note, broadcasting services revenues were $2.2B in , representing a 46% share of the downstream segment. While Satellite Communication remained the sector of activity that accounted for the majority of revenues (81%), Navigation was the sector that experienced the highest growth (108%) in . Domestic revenues decreased by 2.4% year-over-year and totalled $3.4B in . Export revenues, on the other hand, increased by 7%, totalling $2.3B.
The space sector workforce totalled 9,567 space-related full-time equivalents (FTEs) in , of whom 61% were STEM (science, technology, engineering and mathematics) related employees and 64% were highly qualified personnel (HQP) (who are defined as employees in possession of at least a bachelor's degree). Space companies hired 741 employees, of whom 26% were women and 74% were men. Academic organizations contributed 20% of the total space sector workforce with 1,909 FTEs, of whom 92% were HQP.
Business expenditures on R&D (BERD) totalled $356M in , with 74 organizations undertaking space R&D projects. This represents a 2% decrease over results, with BERD down by $7M. Space sector organizations reported a total of 170 new inventions and 53 new patents registered in .
In , the top 30 Canadian space organizations, which included 4 universities and 22 small and medium enterprises (SMEs), generated 96% of total space revenues and represented 78% of space employment. They also accounted for 89% of BERD and 68% of registered patents, but only 33% of inventions.
SMEs accounted for 94% of all Canadian space companies in . Together, SMEs accounted for 43% of Canadian space sector revenues and 31% of all employees.

RADARSAT Constellation Mission
The RADARSAT Constellation Mission is Canada's new generation of Earth observation satellites. Launched on , the three identical satellites work together to bring solutions to key challenges for Canadians. () (Credit: CSA)
2. Economic Impact Analysis
In this section
Key Result
- In , the space sector contributed $2.5B to Canada's GDP and supported a total of 20,891 jobs.
The methodology used for the following economic impact analysis is detailed in Annex B.
Economic Impact – Gross Domestic Product
In , the space sector contributed $2.5B to Canada's GDP, which represents the value of all final goods and services produced by the space sector within Canada. Total GDP contribution was broken down into the following:
- $1.29B in space sector impacts;
- $0.60B in supply industry impacts; and
- $0.57B in impacts related to consumer spending by associated employees.
The space sector creates benefits in the larger economy with a GDP multiplier of 1.90 (Total GDP Impact / Space Sector GDP Impact). In other words, every dollar that the space sector contributed to the GDP resulted in an additional $0.90 in GDP contributions from the larger economy.
| Space Sector | Supply Industry | Consumer Spending by Employees | |
|---|---|---|---|
| $B in | 1.29B | 0.6B | 0.57B |
Economic Impact – Jobs Supported
In , the space sector supported a total of 20,891 jobs in Canada. The total workforce contribution was broken down into the following:
- 9,567 space sector jobs;
- 6,013 supply industry jobs; and
- 5,311 jobs created and supported as a result of consumer spending by associated employees.
The space sector therefore creates jobs in the larger economy with a workforce multiplier of 2.18 (Total Workforce Impact / Space Sector Workforce Impact). In other words, every job in the space sector supports another 1.18 jobs in the economy.
| Space Sector | Supply Industry | Consumer Spending by Employees | |
|---|---|---|---|
| Workforce in | 9,567 | 6,013 | 5,311 |
3. Overall Results
In this section
Key Results
- In , total revenues in the Canadian space sector reached $5.7B.
- While Ontario and Quebec had the highest space revenues, the Prairies experienced the highest revenue growth in .
- The Canadian space workforce declined by 4% in , and totalled 9,567 space-related FTEs.
- Quebec and Ontario accounted for 77% of space sector jobs.
- STEM workforce experienced a 3% growth in , totalling 5,795 FTEs and accounting for 61% of the Canadian space workforce.
- With 6,152 FTEs, HQP (employees with at least a bachelor's degree) accounted for 64% of the workforce.
- Canadian space companies hired 741 employees, of whom 26% (196) were women and 74% (545) were men.
Total Revenues
In , total revenues in the Canadian space sector remained stable, totalling $5.7B, a 1.3% ($75M) growth year-over-year. The average annual growth rate of the space sector between and was 1.3%.Footnote 1 A detailed analysis of the source of this growth can be found in the section of this report on Revenues by Markets and Customers.
Of note, the findings presented throughout this report are provided at current prices (i.e. unadjusted for inflation).
| Revenues | 5,383 | 5,298 | 5,530 | 5,595 | 5,671 |
|---|

Dextre and Canadarm2
Photo of Canadarm2 taken by CSA astronaut David Saint-Jacques during his mission on the International Space Station () (Credit: NASA)

Canada launches the Junior Astronauts campaign
An exciting new initiative to engage young Canadians in activities related to space and science. () (Credit: CSA)
Total Workforce
The space sector workforce totalled 9,567 FTEs in , a 4% decline, or -375 FTEs. The space sector workforce is evenly divided between upstream and downstream segment organizations with 50% of FTEs in each segment.
Note that workforce data do not include government employees. While the CSA employed 679 employees in , this number does not include government employees in other departments (e.g. Department of National Defence or Natural Resources Canada) that also work on space-related matters or use space-based data to deliver services to Canadians.
| Workforce | 10,012 | 9,927 | 9,883 | 9,942 | 9,567 |
|---|
In , space companies hired 741 employees, including employees either new to the space sector or coming from other space companies. Of those 741 employees, 26% (196) were women and 74% (545) were men.
| Men | Women | |
|---|---|---|
| Gender distribution | 74% | 26% |

Canadian CubeSat Project electrical assembly workshop
Students from the Canadian CubeSat Project teams attend an electrical assembly workshop and receive training on soldering and harnessing. () (Credit: CSA)
Methodology Change and New Indicators
In the survey, the CSA made changes to the methodology used to calculate its workforce-related indicators, such as highly qualified personnel (HQP). In previous years, HQP was measured as the number of engineers, scientists and technicians working in the space sector. As of the survey, the number of HQP is instead measured as the number of space-related employees who have at least a bachelor's degree. This methodological change allows the CSA to be more aligned with Statistics Canada's definition of HQP, enabling comparisons with other sectors of the economy.
Surveys conducted prior to
- HQP = Engineers, scientists and technicians
survey
- HQP = Employees having completed at least a bachelor's degree
- STEM = Engineers, scientists, technicians, management, health professionals, and students
In addition, the CSA added an indicator measuring the number of space employees involved in STEM activities (i.e. science, technology, engineering and mathematics). This indicator tracks the number of engineers, scientists, technicians, management, health professionals and students working in the space sector. Management employees are included in the STEM indicator because a vast majority of employees in this category are managing STEM-related activities. Similarly, students were included in this indicator, because the vast majority of students employed by space companies are directly involved in STEM activities. This methodology aligns closely with Statistics Canada's and the OECD's definitions of STEM employees.
Occupations
The CSA divides the space workforce into eight main occupation categories: Engineers and Scientists, Technicians, Management, Administration, Marketing and Sales, Students, Health Professionals, and Other Employees.
In , engineers and scientists comprised the largest category of employment with 3,131 FTEs, representing 33% of the total space workforce. Employees in the administration category made up the second largest group with 2,498 FTEs, accounting for 26% of the workforce. Technicians accounted for 10% of the workforce with 989 FTEs. Management, marketing and sales, students, and other employees made up the remainder.
| Management | Engineers and Scientists |
Technicians | Marketing and Sales |
Administration | Other | Students/ Interns |
Health Professionals |
|
|---|---|---|---|---|---|---|---|---|
| 7% | 32% | 11% | 5% | 28% | 10% | 7% | 0.04% |
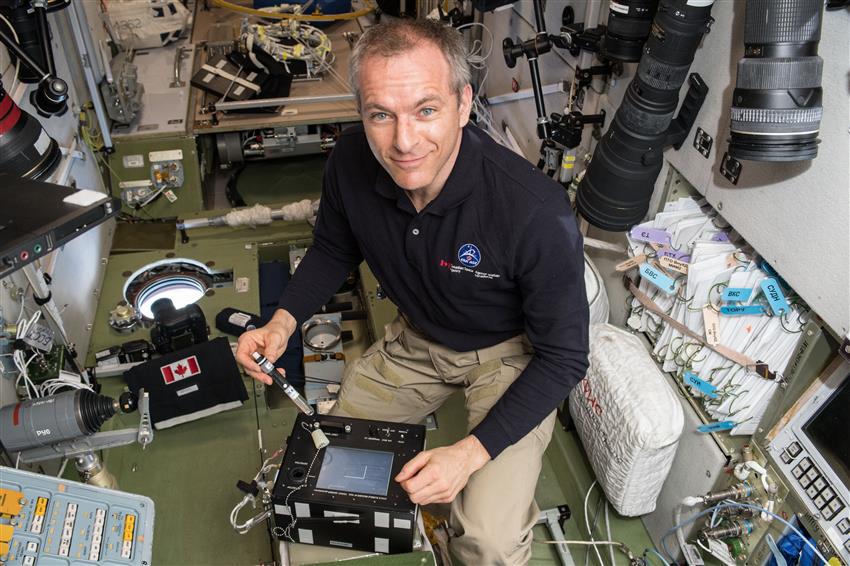
David Saint-Jacques does an experiment during his space mission
CSA astronaut David Saint-Jacques is placing finger-sized tubes of polymer gel, known as bubble monitors, around the International Space Station for the Radi-N2 study. This Canadian space research could help reduce radiation risks for future space travellers. () (Credit: NASA)
STEM Employees
The STEM measurement tracks the number of engineers, scientists, technicians, management, health professionals and students working in the space sector. STEM employees totalled 5,795 FTEs and represented 61% of the total Canadian space workforce, but there are significant differences between the upstream and the downstream segments: 83% of the workforce in the upstream segment are STEM, while only 38% of the workforce in the downstream segment are STEM.
The breakdown of STEM workforce by region largely followed the regional breakdown of the total space workforce. The majority of STEM employees can be found in Ontario and Quebec, which accounted for 43% (2,486 FTEs) and 26% (1,510 FTEs) of Canada's STEM workforce, respectively. The Prairies followed with 16% (916 FTEs) of Canada's STEM workforce. B.C. accounted for 10% (552 FTEs) of Canada's STEM workforce, while the Atlantic region accounted for 6% (331 FTEs) of Canada's STEM workforce.
Of particular note is the number of STEM employees by region. In the Prairies and B.C., STEM employees accounted for 95% and 87% of the provincial space workforce, respectively. STEM employees accounted for 61% of the space workforce in Ontario, 47% in Quebec and 45% in Atlantic Canada. A lower share of STEM employees often reflects an industry that includes more downstream companies (especially broadcasting companies), which tend to employ a higher number of administrative employees.
| Ontario | Quebec | Atlantic | British Columbia | Prairies | |
|---|---|---|---|---|---|
| 43% | 26% | 6% | 10% | 16% |
| British Columbia | Prairies | Ontario | Quebec | Atlantic | Total |
|---|---|---|---|---|---|
| 552 | 916 | 2,486 | 1,510 | 331 | 5,795 |

Simulated lunar sample return mission
The Lunar Exploration Analogue Deployment (LEAD) field tests put the CSA's Juno rover prototypes in harsh environments to, in particular, test navigation systems. () (Credit: CSA)
Highly Qualified Personnel (HQP)
As noted above, the definition of HQP changed in the survey and is now defined as the number of employees having at least a bachelor's degree. In , HQP accounted for 64% of Canada's space workforce, or 6,152 FTEs. While 77% of the upstream workforce are HQP, only 52% of the downstream workforce are HQP.
Overall, 42% (2,553) of Canada's HQP worked in Ontario in , while 29% (1,803) of them worked in Quebec. The Prairies accounted for 13% (815) of Canada's HQP. B.C. and the Atlantic region accounted for 9% (537) and 7% (443) of Canada's HQP, respectively.
In both B.C. and the Prairies, HQP accounted for 84% of the workforce. HQP accounted for 63% of the workforce in Ontario, 60% in Atlantic Canada and 57% in Quebec.
Our previous definition of HQP tracked the numbers of engineers, scientists and technicians in the Canadian space sector. According to this definition, the number of engineers, scientists and technicians decreased by 4%, or 183 FTEs, year-over-year, numbering 4,120 employees in .
| Ontario | Quebec | Atlantic | British Columbia | Prairies | |
|---|---|---|---|---|---|
| 42% | 29% | 7% | 9% | 13% |
| Total Workforce | Total HQP | % of HQP Relative to Total Regional Workforce |
% of HQP Relative to Total Number of HQP in Canada's Space Workforce |
|
|---|---|---|---|---|
| British Columbia | 638 | 537 | 84% | 9% |
| Prairies | 966 | 815 | 84% | 13% |
| Ontario | 4,047 | 2,553 | 63% | 42% |
| Quebec | 3,182 | 1,803 | 57% | 29% |
| Atlantic | 734 | 443 | 60% | 7% |
| Total | 9,567 | 6,152 | - | - |
Space Labour Force Challenges and Needs
In , 58% of Canadian space companies faced difficulties hiring personnel to the extent that positions went unfilled. The professions for which companies had the most difficulties finding employees were engineers, scientists and technicians, as well as marketing and sales personnel. The two main reasons highlighted for hiring difficulties were competition from other industrial sectors for the same talent, followed by applicants lacking the skills required for the position.
Companies dealing with employee shortage used three main strategies to deal with the problem: they provided internal training to their employees, they shared the workload amongst existing employees and they outsourced some of the work.
Over the next five years, Canadian space companies will be looking for employees with sought-after skills related to software development, electrical engineering systems, mechanical engineering systems, as well as business development and commercialization.
Regional Distribution and Trends
The proportional share of total revenues and employment by province remained relatively stable from year to year.
| Ontario | Quebec | Atlantic | British Columbia | Prairies | |
|---|---|---|---|---|---|
| 58% | 26% | 7% | 4% | 5% |
| B.C. | Ontario | Quebec | Atlantic | |
|---|---|---|---|---|
| Percentage change | -30% | 21% | -19% | 37% |
| Export | Domestic | Export | Domestic | |
|---|---|---|---|---|
| British Columbia | 132 | 158 | 112 | 103 |
| Prairies | 258 | 74 | 271 | 40 |
| Ontario | 1,189 | 1,783 | 1,398 | 1,878 |
| Quebec | 266 | 1,262 | 288 | 1,165 |
| Atlantic | 275 | 197 | 207 | 208 |
Revenues by Region
British Columbia
In , British Columbia had revenues of $215M, a decline of 26% ($75M) over revenues. Domestic revenues declined by 35%, or $56M, from $158M in to $103M in . Export revenues also declined by 15%, or $20M, from $132M to $112M between and .
Between and , B.C.'s total revenues decreased by 30% from $309M to $215M. This decline was driven by a 55% decline in domestic revenues, from $226M to $103M. Over the same period, export revenues grew by 36%, from $83M to $112M.
B.C. accounted for 4% of Canadian space sector revenues in . There were twice as many upstream organizations in B.C. as downstream organizations. Upstream segment organizations generated 58% of the province's space revenues and downstream segment organizations generated 42% of the province's space revenues. B.C. is the only province where the upstream segment generates more revenues than the downstream segment.
Prairies (Alberta, Saskatchewan and Manitoba)
Revenues in the Prairies declined by 6%, or $22M, over , and totalled $311M. Domestic revenues declined by 47%, or $35M, from $74M in to $40M in ; export revenues increased by 5%, from $258M in to $271M in .
- Alberta revenues decreased by 3%, or $7M, from $245M to $238M.
- Saskatchewan revenues declined by 2%, or $1M, from $55M to $54M.
- Manitoba revenues declined by 41%, or $13M, from $32M to $18M.
Between and , total revenues grew by 16%, from $268M in to $311M in . Although domestic revenues declined by 61%, from $101M in to $40M in , exports grew by 63%, from $167M to $271M, in the same period.
The Prairies accounted for 5% of Canadian space sector revenues in . Thirty percent of space revenues in the region came from the upstream segment, while 70% came from the downstream segment.
Ontario
Revenues in Ontario grew by 10%, or $303M, in and totalled $3.3B. Domestic revenues grew by 5%, or $95M, reaching $1.9B, while exports also grew by 5%, from $1.2B in to $1.4B in .
Total revenues in Ontario increased by 21% between and . This growth was driven by export revenues, which grew by 53%, from $913M to $1.4B. Domestic revenues grew by 5%, from $1.8B in to $1.9B in .
Ontario accounted for 58% of Canadian space sector revenues in . Almost two-thirds of Ontario space organizations worked in the upstream segment. However, downstream segment organizations accounted for 75% of revenues in the province due to significant revenue in satellite operations, manufacturing of satellite communication hardware (such as satellite terminals), and broadcasting services. Upstream organizations accounted for the remaining 25% of revenues.
Quebec
Revenues in Quebec declined by 5%, or $74M, in , totalling $1.5B. Domestic revenues decreased by 8%, or $97M, from $1.3B in to $1.2B in ; exports grew by 8%, from $266M in to $288M in .
Between and , Quebec's total revenues decreased by 19%, from $1.8B to $1.5B. This was driven by a 25% decline in domestic revenues, which went from $1.6B in to $1.2B in . Export revenues grew by 21%, from $238M to $288M, over the same period.
Quebec accounted for 26% of Canadian space sector revenues in . Quebec had almost four times as many upstream segment organizations as downstream segment organizations, while revenues were heavily concentrated in the downstream segment (80%) rather than in the upstream (20%).
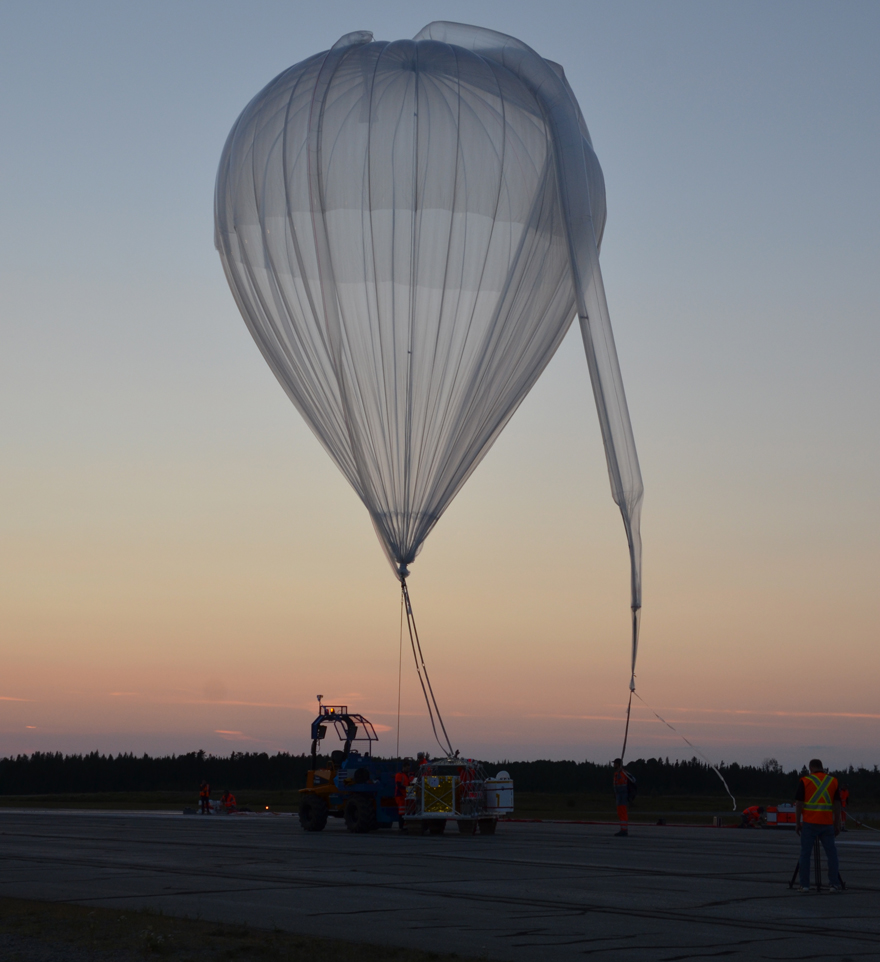
Stratos – campaign of stratospheric balloons
From to , five stratospheric balloons were launched from the Timmins Stratospheric Balloon Base to test new technologies and conduct science experiments. Each flight lasted about 10 hours at an altitude ranging from 33 to 36 kilometres. (Credit: CSA)
Atlantic Canada (New Brunswick, Newfoundland and Nova Scotia)
In , revenues in the Atlantic region decreased by 12%, or $57M, from $472M in to $415M in . Export revenues declined by 25%, from $275M in to $207M in . Domestic revenues grew by 5%, or $11M, from $197M in to $208M in .
- Revenues in Newfoundland declined by 27% in and totalled $224M.
- Revenues in New Brunswick grew by 16% year-over-year, with revenues reaching $187M.
- Revenues in Nova Scotia decreased by 10% in and totalled $4.7M.
Between and , total revenues in the Atlantic region grew by 37%, or $111M, from $304M in to $415M in , due to a growth in both domestic and export revenues. Domestic revenues grew by 40%, from $148M in to $208M in , while export revenues grew by 33%, from $156M in to $207M in .
The Atlantic region accounted for 7% of Canadian space sector revenues in . In Atlantic Canada, there are a few small to medium-sized upstream segment players, which are mainly in academia, and a handful of downstream segment organizations. Downstream segment organizations accounted for 96% of revenues in and upstream segment organizations accounted for the remaining 4%.
Workforce by Region
- British Columbia: 7% (638 FTEs) of Canada's space workforce, an increase of 12% (70 employees) over last year.
- Prairies: 10% (966 FTEs), a decline of 4% (-39 employees).
- Ontario: 42% (4,047 FTEs), a decline of 5% (-221 employees).
- Quebec: 33% (3,182 FTEs), a decline of 6% (-202 employees).
- Atlantic Canada: 8% (734 FTEs), an increase of 2% (17 employees).
| Engineers & Scientists |
Technicians | Management | Administration | Marketing and Sales |
Students/ Interns |
Health Professionals |
Other | Total | % of Total Workforce |
|
|---|---|---|---|---|---|---|---|---|---|---|
| B.C. | 338 | 88 | 61 | 45 | 34 | 65 | 0 | 7 | 638 | 7% |
| Prairies | 592 | 95 | 71 | 23 | 7 | 155 | 3 | 20 | 966 | 10% |
| Ontario | 1,230 | 398 | 327 | 917 | 219 | 532 | 0 | 426 | 4,047 | 42% |
| Quebec | 821 | 336 | 196 | 1,386 | 112 | 156 | 1 | 174 | 3,182 | 33% |
| Atlantic | 150 | 73 | 44 | 127 | 89 | 64 | 0 | 187 | 734 | 8% |
| Total | 3,131 | 989 | 699 | 2,498 | 460 | 972 | 4 | 814 | 9,567 | 100% |
4. Revenues by Markets and Customers
In this section
Key Results
- In , the upstream segment generated roughly $0.8B in revenues, while the downstream segment generated $4.9B in revenues.
- While the services sub-segment accounted for the majority of revenues, growth mostly occurred in the products and applications, as well as space systems manufacturing sub-segments.
- In terms of sectors of activities, 81% of revenues came from Satellite Communication. However, the Navigation sector experienced the highest growth year-over-year.
- Canadian space exports increased by 7%, reaching $2.3B. The U.S. remained the main export destination, accounting for 57% of space export revenues.
- Overall, 15% of the space revenues were derived from government sources and 85% from non-government sources.
Market Share by Value-Chain Segments
Space sector revenues can be broken down into value-chain segments and sub-segments based on the type of work that the organization is carrying out in order to produce goods and services. The two main segments are upstream and downstream activities. The upstream segment — comprised of the research, engineering and consulting as well as space and ground segment manufacturing sub-segments — generated $0.8B in revenues in . The downstream segment — comprised of the satellite operations, manufacturing of products (e.g. terminals), development of software applications, and the provision of services (e.g. broadcasting) sub-segments — generated $4.9B in revenues in . A detailed description of the value-chain categorization is provided in Annex C. Revenues in each sub-segment can be broken down as follows:
- Research, Engineering and Consulting amounted to $220M in , a 13% growth ($25M) from . This sub-segment accounted for 4% of total revenues in .
- Space Segment Manufacturing amounted to $415M in , a 20% growth ($69M) from . It accounted for 7% of total revenues.
- Ground Segment Manufacturing amounted to $178M in , a 53% decline (-$203M) from . It accounted for 3% of total revenues.
- Satellite Operations amounted to $928M in , a 5% decline (-$52M) from . It accounted for 16% of total revenues.
- Products and Applications reached $1.4B in , a 32% growth ($326M) from . It accounted for 24% of total revenues.
- Services amounted to $2.6B in , a 3% decline (-$89M) from . It accounted for 45% of total revenues in .
| Downstream | Upstream | |||||
|---|---|---|---|---|---|---|
| Services | Products and Applications | Satellite Operations | Ground Segment Manufacturing | Space Segment Manufacturing | Research, Engineering and Consulting | |
| 45% | 24% | 16% | 3% | 7% | 4% | |
Market Share by Sector of Activity
In , revenue growth occurred in Navigation and Space Exploration. Revenues remained stable in Space Science and declined in Satellite Communication and Earth Observation. Trends for the – period are detailed below.
Satellite Communication
In , Satellite Communication generated $4.6B in revenues, accounting for 81% of total space revenues. The vast majority (91%) of Satellite Communication revenues was derived from activities in the downstream segment, broken down as follows:
- Satellite Operations: $913M
- Products and Applications (e.g. antennas): $770M
- Broadcasting Services: $2.2B
- All other telecommunication services: $285M
The remainder of Satellite Communication revenues (9%) was related to upstream segment activities:
- Research, Engineering and Consulting: $38M
- Space Segment Manufacturing: $274M
- Ground Segment Manufacturing: $121M
Satellite Communication revenues declined by 3%, or $119M, in . Between and , Satellite Communication revenues experienced a 3% growth, or $113M, from $4.5B to $4.6B.
Earth Observation (EO)
In , EO revenues totalled $278M, accounting for 5% of total space revenues. The majority of EO revenues (59%) was in the upstream segment:
- Research, Engineering and Consulting: $32M
- Space Segment Manufacturing: $81M
- Ground Segment Manufacturing: $49M
The remainder of revenues (41%) was related to activities in the downstream segment:
- Satellite Operations: $12M
- Products and Applications: $47M
- Services: $55M
EO revenues declined by 29%, or $113M, in . Between and , EO revenues experienced a decline of 46%, or $238M, from $516M to $278M.
Space Exploration
Space Exploration revenues totalled $123M in , accounting for 2% of total space revenues. The upstream segment accounted for 99% of Space Exploration revenues, distributed as follows:
- Research, Engineering and Consulting: $82M
- Space Segment Manufacturing: $36M
- Ground Segment Manufacturing: $3.2M
The remainder of revenues was related to activities in the downstream segment:
- Satellite Operations: $0.4M
- Products and Applications: $0.2M
- Services: $0.5M
Space Exploration revenues grew by 7%, or $8M, in . Between and , revenues from Space Exploration grew by 9%, or $10M, from $113M to $123M.
Navigation
Navigation revenues reached $559M in , which amounted to 10% of total space revenues. In Canada, 98% of space activities related to Navigation are in the downstream segment. Navigation revenues are broken down as follows:
- Satellite Operations: $0.9M
- Products and Applications: $530M
- Services: $15M
The remainder of activities, which relate to the upstream segment, amounts to roughly $13M, divided as follows:
- Research, Engineering and Consulting: $12M
- Space Segment Manufacturing: $0.2M
- Ground Segment Manufacturing: $0.5M
From to , revenues grew by 108%, or $290M. Navigation activities were the main driver behind the revenue growth seen in the Canadian space sector in and was largely due to the addition of new companies to the survey. Between and , revenues from Navigation increased by 195%, or $369M, from $190M to $559M.
Space Science
In , Space Science revenues totalled $66M, which represents 1% of total space revenues. The majority of space science revenues was in the upstream segment:
- Research, Engineering and Consulting: $43M
- Space Segment Manufacturing: $6M
- Ground Segment Manufacturing: $3.4M
With the remainder in the downstream segment:
- Satellite Operations: $1.2M
- Products and Applications: $6.6M
- Services: $5.2M
Space Science remained stable at $66M in . Between and , revenues from Space Science increased by 39%, or $18M, from $48M to $66M.
Other Revenues
From to , other revenues grew by 44%, from $20M to $29M, and accounted for 1% of total space revenues. Activities that fall into the "Other
" sector are by nature variable and subject to re-categorization; therefore, changes in this sector are less statistically relevant than for the previously noted sectors.
| Satellite Communication | Navigation | Space Exploration |
Earth Observation |
Space Science |
Other | |
|---|---|---|---|---|---|---|
| 81% | 10% | 2% | 5% | 1% | 1% |
| Satellite Communication |
Navigation | Space Exploration |
Earth Observation |
Space Science |
Other | |
|---|---|---|---|---|---|---|
| Percentage change | 3% | 195% | 9% | -14% | 39% | 5% |
| Downstream | Upstream | |||||
|---|---|---|---|---|---|---|
| Services | Products and Applications |
Satellite Operations | Ground Segment Manufacturing |
Space Segment Manufacturing |
Research, Engineering and Consulting |
|
| 54% | 17% | 20% | 3% | 6% | 1% | |

Getting ready for a first spacewalk
CSA astronaut David Saint-Jacques is getting ready for his first spacewalk with NASA astronaut Anne McClain, on . (Credit: NASA)
Market Share by Customer Location
Domestic vs. Export Revenues
In , Canadian space revenues totalled $5.7B, of which 60% ($3.4B) was from domestic sources and 40% ($2.3B) was from exports. Domestic revenues declined by 2%, or $82M, in ; exports grew by 7%, or $157M.
The average growth rate between and was 1.3% for the entire space sector, -3% for domestic revenues, and 10% for exports.
When excluding broadcasting, total revenues generated by the Canadian space sector grew from $2.7B in to $3.5B in . With the exclusion of broadcasting, the average growth rate between and was 6.2% for the entire space sector, 0.4% for domestic revenues and 10% for exports.
| Domestic Revenues | Export Revenues | |
|---|---|---|
| 3,826,446,289 | 1,556,602,010 | |
| 3,704,150,826 | 1,594,323,346 | |
| 3,545,430,399 | 1,984,715,754 | |
| 3,475,200,911 | 2,120,153,923 | |
| 3,393,663,363 | 2,276,926,547 |
| Domestic Revenues | Export Revenues | |
|---|---|---|
| 3,826 | 1,557 | |
| 3,704 | 1,594 | |
| 3,545 | 1,985 | |
| 3,475 | 2,120 | |
| 3,394 | 2,277 |
Export Regions
Export revenues reached $2.3B in , although not all export markets grew at the same rate.
The U.S. remained the main destination for Canadian space exports, with 57% of total exports. Revenues derived from exports to the U.S. grew by 32%, or $315M, from $984M in to $1.3B in .
Europe remained Canada's second largest market for space exports. Canadian exports to Europe declined by 12%, or $61M, from $512M in to $451M in . Europe accounted for 20% of total exports.
Exports to Asia declined by 22%, or $82M, from $364M in to $282M in . Asia accounted for 12% of total exports.
Exports to South America declined by 1%, or $1.2M, from $119M in to $118M in . The region accounted for 5% of total exports.
Exports to Central America, the Caribbean and Mexico grew by 14%, or $4.7M, from $34M in to $39M in . This region accounted for 2% of total export revenues.
Exports to Oceania grew by 25%, or $4.8M, from $19M in to $24M in . Oceania accounted for 1% of total export revenues.
Export revenues from Africa decreased by 5%, or $1.4M, from $27M in to $25M in . Generally speaking, export growth to this region has been uneven; years of strong growth have been followed by declines and vice versa. Africa accounted for 1% of total Canadian space export revenues.
Finally, in , 2% of total exports, or $38M, was not allocated to a specific region of the world.
| United States | Europe | Asia | South America | Africa | Oceania | Central America, Caribbean, Mexico | Other | |
|---|---|---|---|---|---|---|---|---|
| 57% | 20% | 12% | 5% | 1% | 1% | 2% | 2% |
| United States | 797 | 854 | 918 | 984 | 1,299 |
|---|---|---|---|---|---|
| Europe | 354 | 354 | 470 | 512 | 451 |
| Asia | 256 | 232 | 289 | 364 | 282 |
| South America | 96 | 100 | 96 | 119 | 118 |
| Africa | 14 | 8 | 21 | 27 | 25 |
| Oceania | 12 | 14 | 34 | 19 | 24 |
| Central America, Caribbean, Mexico | 6 | 7 | 29 | 34 | 39 |
| Other | 22 | 24 | 128 | 61 | 38 |

Industry delegation in the United Arab Emirates
From to , the President of the Canadian Space Agency, Sylvain Laporte, led a Canadian industry delegation to the Global Space Congress in the United Arab Emirates. () (Credit: Mohammed bin Rashid Space Centre)
Market Share by Customer Type
Customers are categorized as either government or non-government. Government customers include domestic governments (municipal, provincial, federal) and foreign governments. Non-government customers include businesses, individual consumers and non-profit organizations or foundations (both domestic and foreign).
Overall, 15% of the space revenues in were derived from government customers and 85% from non-government customers. It is important to note that government customers make up the majority of market share in some sectors, such as Space Exploration and Space Science, whereas Satellite Communication customers are primarily non-government.
Upstream segment organizations derive the majority of their revenues from government clients, while downstream segment organizations derive their revenues almost exclusively from non-government clients. The upstream segment derived 57% of revenues from non-government clients in , whereas the downstream segment derived 90% of revenues from non-government clients. It is worth noting that some downstream segment organizations get a significant share of their revenues from government contracts. For example, EO downstream companies derived 63% of their revenues from government clients in (compared to 10% for downstream companies overall). In that respect, they face similar challenges to companies in the upstream segment.
| Government | Non-Government | |
|---|---|---|
| Canadian space sector | 15% | 85% |
| Government | Non-Government | |
|---|---|---|
| Upstream segment | 43% | 57% |
| Government | Non-Government | |
|---|---|---|
| Downstream segment | 10% | 90% |
Domestic Customer Breakdown by Type
In , 90% of domestic revenues were from non-government clients. Non-government customers can be individuals, such as subscribers to television and radio broadcasting services. Other non-government customers include businesses, where space-derived information products are integrated into business operations (e.g. Navigation and EO data). A small portion of non-government revenues is tied to financing or sales to non-profit organizations and foundations.
Government customers make up the remaining 10% of the domestic market. Government customers represent the majority of domestic upstream revenue, where they constitute 80% of revenues. Government customers are mainly involved in the research, engineering and consulting segment. Non-government revenues constitute the remaining 20%. In the domestic downstream segment, the situation is reversed, as government customers account for only 2% of revenues.
The majority of government funding comes from federal sources. The top five sources of federal government revenue reported by space organizations in were the CSA, the Department of National Defence (DND), the Natural Sciences and Engineering Research Council (NSERC), the Canada Foundation for Innovation (CFI), and Public Services and Procurement Canada (PSPC).
| Federal Governement | Municipal Government | Provincial Government | Governement | Non-Governement | |
|---|---|---|---|---|---|
| 9% | 0.03% | 0.6% | 0.01% | 90% |
Foreign Customer Breakdown by Type
Non-government customers are the largest market segment abroad, accounting for 77%, or $1.8B, of export revenues. Government clients make up the remaining 23%, or $514M, of exports. This is equally true for both the upstream and downstream segments, where non-government revenues account for 81% and 75% of revenues, respectively.
Exports to commercial clients are strong in three main areas of the value chain: Manufacturing, Satellite Operations, and Products and Applications. In terms of manufacturing, several companies are producing components and parts for foreign prime companies through global value chains, with very occasional sales related to manufacturing of complete end-to-end space systems. Satellite Operations include primarily sales related to operations for commercial telecommunications systems. Products and Applications sold to non-government customers are mostly related to antennas, receivers and other ground equipment in the Navigation and Satellite Communication sectors. Non-government exports for EO are limited, but a small market does exist for data and software applications.
There is also a small portion of non-government organizations, mainly foundations, that provide funding to Canadian universities and research centres. This is a relatively small amount and it is categorized as export revenue in the consolidated analysis of the Canadian space sector.
| Governement | Non-Governement | |
|---|---|---|
| 23% | 77% |
5. Innovation
In this section
Key Results
- Business Expenditures on R&D (BERD) totalled $356M in , a 2% decrease from the previous year.
- R&D intensity for space manufacturing was 11 times higher than the average for manufacturing in Canada.
- Canadian space companies derived $282M in revenues through the commercialization of externally funded R&D projects, a 14% decrease from .
- Space sector organizations reported a total of 170 inventions and 53 registered patents.
Business Expenditures on R&D (BERD) (Companies Only)
In , there were 74 companies engaged in R&D activities, with BERD reaching $356M. This represents a 2% decline from the $363M spent in BERD in . Upstream organizations were responsible for 49% of total space sector BERD.
Half of R&D spending in was financed through internal sources (e.g. company profits reinvested in R&D), while the other half was financed through external funding sources (e.g. government grants and contributions). Externally (i.e. government) funded R&D reached $178M in and internally (i.e. company) funded R&D reached $179M.
| Large firms | SMEs | |
|---|---|---|
| Firm size | 45% | 55% |
| Upstream | Downstream | |
|---|---|---|
| Market segment | 49% | 51% |
R&D Intensity Level (Companies Only)
The R&D intensity indicator reflects the ratio of BERD spending relative to the GDP contribution of the space sector. It serves as an indicator of the level of effort and investment by a company (or by an industry as a whole) in innovative activities such as the creation of new products, services and technologies, or the improvement of business functions such as production techniques. Overall, space sector R&D intensity is 33%. The upstream segment is more R&D intensive than the downstream: upstream R&D intensity is 38%, while downstream R&D intensity is 29%. The R&D intensity for the manufacturing sub-segment (in the upstream) is 33%, which is 11 times higher than the average for manufacturing in Canada.
Commercialization of Externally Funded R&D Projects (All Organizations)
Organizations report on the level of commercialization of projects that were initially funded by government (externally funded R&D). In , 40 organizations derived $283M in revenues through the commercialization of externally funded R&D projects, a 14% decline from commercialization revenues. The upstream segment accounted for 75% of commercialization revenues, while the downstream segment accounted for the remaining 25%. Almost all commercialization takes place through companies.
Inventions and Patents (All Organizations)
In , 43 organizations reported having made an invention and 22 organizations registered a patent. Between and , the number of organizations with inventions and registered patents decreased by 22% (from 55 organizations in ) and 37% (from 35 organizations in ), respectively. Between and , the number of organizations with inventions declined by 26% (from 58 to 43), while the number of organizations registering patents declined by 24% (from 29 to 22).
A total of 170 inventions and 53 registered patents were reported in . The number of inventions declined by 16%, from 203 in to 170 in . The number of registered patents declined by 55%, from 118 in to 53 in .
Upstream organizations accounted for the majority of inventions and registered patents, with 65% of all inventions reported and 53% of patents filed. This is a reflection of the composition of survey respondents, with almost three-quarters of respondents in the upstream segment. In , upstream organizations registered 28 patents and reported 110 inventions, while downstream organizations registered 25 patents and reported 60 inventions.

Lunar Gateway
Artist's view of Gateway, a small space station that will orbit the Moon, where we see the concept of Canadarm3, Canada's smart robotic sytem (top, just left of centre). () (Credit: NASA)
6. Results by Types of Organizations
In this section
Key Results
- Canada's top 30 companies accounted for 97% of revenues and 78% of the workforce in .
- Ninety-four percent of Canadian space companies were SMEs in ; they accounted for 43% of Canadian space sector revenues and 31% of all employees.
- University and research centre revenues amounted to $109M, representing 1.9% of total revenue. They contributed 20% of the total space sector workforce with 1,909 full-time equivalents.
Canada's Leading Space Organizations
In , Canada's top 30 space organizations (i.e. based on their revenues) generated 97% of space revenues and accounted for 78% of space employment, which is consistent with results from previous years despite changes in the composition and rank of the top 30 space organizations. Canada's top 30 organizations account for 89% of BERD and 68% of registered patents, but only 33% of inventions. Most of the top 30 organizations were companies; however, four academic organizations were also represented. Sixty percent of the top 30 organizations were downstream companies, the remaining 40% including upstream segment companies and universities.
By comparison, the top 10 organizations accounted for 83% of total space revenues and 46% of employment. Canada's top 10 organizations accounted for 58% of BERD, 6% of inventions and 15% of registered patents. Nine of the top 10 organizations were downstream segment companies.
Large companies, classified as having 500 employees or more, are rare in the space sector. Only 6% of the companies surveyed were classified as large enterprises in .
Fifty-six organizations reported space revenues in excess of $1M during .
Small and Medium-Sized Enterprises (SMEs)
Ninety-four percent of Canadian space companies were SMEs in , and many of Canada's top space companies were SMEs (defined as employing 1 to 499 workers). SMEs were concentrated most heavily in research, engineering and consulting activities in the upstream segment and in the production of products, applications and services in the downstream segment: 71% of the SMEs surveyed were upstream segment companies, while 29% were downstream segment companies. Together SMEs accounted for 43% of Canadian space sector revenues and 31% of all employees in .
Space SMEs are highly innovative. In , they accounted for 40% of all space BERD. Upstream segment space SMEs accounted for 8% of total BERD, while downstream segment SMEs accounted for 32% of total BERD in the space sector. SMEs were also responsible for 79% of inventions and 51% of registered patents in .
Space SMEs are also export-driven. In , 62% of their sales reached customers abroad. The downstream segment accounted for 89% of SMEs' export revenues, while the upstream segment accounted for 11% of SMEs' export revenues.
The SME workforce is highly skilled and specialized. In , 68% of SMEs' workforce classified as HQP (i.e. employees with at least a bachelor's degree), compared to 20% of the workforce in large firms. Similarly, 75% of SMEs' workforce were STEM employees, compared to 37% in large firms.
Universities and Research Centres
University and research centre revenues amounted to $109M in , representing 1.9% of total revenue. Universities and research centres received $105M in domestic funds, mostly from government: $75M from the federal government, $18M from provincial governments and $0.9M from municipal governments. The remainder came from private foundations or companies.
In addition, universities and research centres accessed $3.4M in funding from foreign sources. American organizations were an important source of support for space-related activities in Canadian universities and research centres, with funds totalling $2M. European organizations were the second largest contributor, with funds totalling $1M (of which 68% came from the European Space Agency). The remaining funding came from other regions.
Academic organizations contributed 20% of the total space sector workforce in with 1,909 FTEs, of whom 92% are HQP and 96% are STEM employees. In addition, 46% of the university and research centre workforce was comprised of students, mostly at the graduate level, who were in receipt of wages or a stipend from their university for work as research assistants, teaching assistants, or other employee-type situations.
Regarding regional distribution, universities and research centres in Ontario captured 40% of space-related funding and 48% of the workforce. Organizations in Quebec accounted for 25% of space-related funding and for 20% of workforce. Universities and research centres in the Prairies accounted for 21% of space-related funding and for 20% of workforce. B.C. captured 12% of space-related funding and 6% of the workforce. Universities and research centres in Atlantic Canada accounted for 2.4% of space-related funding and 6% of the workforce.
Of the 36 university and research centre respondents, six reported coming up with inventions in and five filed for patents. In total, Canadian universities and research centres generated 15 inventions and filed 11 patents in , accounting for 9% of space inventions and 21% of registered patents.
Universities and research centres are categorized as part of the upstream segment of the value chain, as they are mostly engaged in research and engineering. However, it is important to note that some universities and research centres also participate in downstream segment activities, such as satellite operations and the development of software and algorithms to transform space data into a space-enabled solution.
| Ontario | Quebec | Atlantic | British Columbia | Prairies | |
|---|---|---|---|---|---|
| Regional distribution of funding | 40% | 25% | 2% | 12% | 21% |
| Ontario | Quebec | Atlantic | British Columbia | Prairies | |
|---|---|---|---|---|---|
| Regional distribution of workforce | 48% | 20% | 6% | 6% | 20% |
7. Conclusion
Overall, the Canadian space sector remained stable in , with revenues of $5.7B, while the workforce declined slightly to 9,567 FTEs. Export revenues grew for the third year in a row, while domestic revenues continued to decline. BERD remained stable in , while commercialization revenues declined to $282M.

Moonset as seen by David Saint-Jacques
This picture of a moonset was taken by CSA astronaut David Saint-Jacques from the International Space Station. () (Credit: NASA)
A. Annex A Economic Trends: –
| Revenues | 5,383 | 5,298 | 5,530 | 5,595 | 5,671 |
|---|
| Domestic Revenues | Export Revenues | |
|---|---|---|
| 3,826 | 1,557 | |
| 3,704 | 1,594 | |
| 3,545 | 1,985 | |
| 3,475 | 2,120 | |
| 3,394 | 2,277 |
| Year | Overall ($) | Domestic ($) | Domestic % | Export ($) | Export % |
|---|---|---|---|---|---|
| 5,383,048,299 | 3,826,446,289 | 71 | 1,556,602,010 | 29 | |
| 5,298,474,172 | 3,704,150,826 | 70 | 1,594,323,346 | 30 | |
| 5,530,146,153 | 3,545,430,399 | 64 | 1,984,715,754 | 36 | |
| 5,595,354,834 | 3,475,200,911 | 62 | 2,120,153,923 | 38 | |
| 5,670,589,911 | 3,393,663,363 | 60 | 2,276,926,547 | 40 |
| Public Revenues | Private Revenues | |
|---|---|---|
| 450 | 3,377 | |
| 447 | 3,257 | |
| 450 | 3,095 | |
| 405 | 3,070 | |
| 334 | 3,059 |
| Year | Public Revenues | Private Revenues |
|---|---|---|
| 449,792,184 | 3,376,654,105 | |
| 447,164,875 | 3,256,985,951 | |
| 450,307,362 | 3,095,123,037 | |
| 405,481,021 | 3,069,719,890 | |
| 334,463,454 | 3,059,199,909 |
| United Stated | 797 | 854 | 918 | 984 | 1,299 |
|---|---|---|---|---|---|
| Europe | 354 | 354 | 470 | 512 | 451 |
| Asia | 256 | 232 | 289 | 364 | 282 |
| South America | 96 | 100 | 96 | 119 | 118 |
| Africa | 14 | 8 | 21 | 27 | 25 |
| Oceania | 12 | 14 | 34 | 19 | 24 |
| Central America, Caribbean, Mexico | 6 | 7 | 29 | 34 | 39 |
| Other | 22 | 24 | 128 | 61 | 38 |
| United Stated | 796,933,956 | 854,276,733 | 917,771,594 | 984,377,868 | 1,299,441,910 |
|---|---|---|---|---|---|
| Europe | 353,667,183 | 353,577,467 | 469,630,403 | 511,604,753 | 450,898,448 |
| Asia | 256,464,215 | 232,103,945 | 288,852,552 | 363,963,814 | 282,266,076 |
| South America | 95,822,808 | 100,393,238 | 95,673,005 | 118,768,200 | 117,568,821 |
| Africa | 14,151,739 | 8,399,427 | 21,319,454 | 26,756,979 | 25,378,751 |
| Oceania | 12,021,875 | 14,093,353 | 33,921,646 | 19,427,205 | 24,221,719 |
| Central America, Caribbean, Mexico | 6,005,134 | 7,362,703 | 29,170,340 | 34,064,675 | 38,795,654 |
| Other | 21,535,100 | 24,116,480 | 128,376,761 | 61,190,428 | 38,355,165 |
| Satellite Commmunication | 4,503 | 4,461 | 4,641 | 4,735 | 4,616 |
|---|---|---|---|---|---|
| Navigation | 190 | 206 | 216 | 269 | 559 |
| Space Exploration | 113 | 112 | 102 | 115 | 123 |
| Earth Observation | 516 | 423 | 495 | 390 | 278 |
| Space Science | 48 | 70 | 61 | 66 | 66 |
| Other | 14 | 27 | 15 | 20 | 29 |
| Satellite Commmunication | 4,503,021,906 | 4,461,043,078 | 4,640,903,947 | 4,735,120,617 | 4,615,929,082 |
|---|---|---|---|---|---|
| Navigation | 189,788,695 | 205,643,650 | 215,513,917 | 268,991,704 | 559,109,223 |
| Space Exploration | 112,820,499 | 111,579,025 | 101,924,315 | 114,615,832 | 122,957,630 |
| Earth Observation | 515,574,621 | 422,510,765 | 495,309,241 | 390,365,118 | 277,547,875 |
| Space Science | 47,669,007 | 70,261,872 | 61,132,519 | 66,065,425 | 66,058,594 |
| Other | 14,173,571 | 27,435,783 | 15,362,216 | 20,196,138 | 28,987,504 |
| Ontario | 2,705 | 2,757 | 2,850 | 2,973 | 3,276 |
|---|---|---|---|---|---|
| Quebec | 1,797 | 1,667 | 1,560 | 1,528 | 1,453 |
| Atlantic | 304 | 335 | 468 | 472 | 415 |
| B.C. | 309 | 281 | 387 | 290 | 215 |
| Prairies | 268 | 259 | 266 | 332 | 311 |
| British Columbia | 308,541,040 | 280,517,113 | 386,996,622 | 290,382,929 | 214,914,678 |
|---|---|---|---|---|---|
| Prairies | 268,047,033 | 259,162,798 | 265,507,652 | 332,403,251 | 310,883,213 |
| Ontario | 2,705,301,452 | 2,757,233,517 | 2,849,572,500 | 2,972,817,122 | 3,276,098,193 |
| Quebec | 1,796,833,378 | 1,666,608,951 | 1,559,705,179 | 1,527,544,588 | 1,453,241,361 |
| Atlantic | 304,325,395 | 334,951,792 | 468,364,201 | 472,206,944 | 415,452,464 |
| Total Workforce | STEM | |
|---|---|---|
| 10,012 | 5,450 | |
| 9,927 | 5,756 | |
| 9,883 | 5,605 | |
| 9,942 | 5,625 | |
| 9,567 | 5,795 |
| Ontario | 4,820 | 4,581 | 4,407 | 4,269 | 4,047 |
|---|---|---|---|---|---|
| Quebec | 3,126 | 3,298 | 3,256 | 3,383 | 3,182 |
| Atlantic | 595 | 591 | 702 | 717 | 734 |
| B.C. | 614 | 590 | 624 | 569 | 638 |
| Prairies | 858 | 867 | 894 | 1,005 | 966 |
| Total | 10,012 | 9,927 | 9,883 | 9,942 | 9,567 |
B. Annex B Methodology
In this section
Questionnaire
In order to measure the changes taking place in Canada's space sector each year, the CSA uses a questionnaire to collect baseline data. Questionnaires are sent to private sector enterprises, not-for-profit organizations, research organizations and universities in Canada that engage in space activities. The questionnaire follows a census model and therefore aims to be as inclusive and exhaustive as possible.
Most organizations that responded to the questionnaire reported on a fiscal year (generally ending ), with the remainder reporting on a calendar year, from to . As in previous years, the questionnaire had a high response rate covering 174 organizations, including all major space players.
Additionally, the CSA performs quality control measures on the survey data to ensure the accuracy of the findings.
Attribution
Data are also added based on CSA transfer payments (Contracts, Grants, and Contributions) in cases where this information has not been included as part of the survey responses.
In addition, there is a limited number of cases where data are compiled from publicly disclosed reports (e.g. for publically traded companies) and verified through consultation with company officials.
Economic Trends
In the edition of this report, the CSA made changes to the methodology, whereby downstream segment organizations were added to the survey population. This led space sector revenues to grow significantly between and . This change specifically impacted indicators for domestic revenues, Satellite Communication revenues, government vs. non-government funding, and workforce. For that reason, the economic trend analysis for this report will only look back at the past five years (–). For information on the economic trends prior to , readers are invited to consult previous editions of this report.
Economic Impact Analysis
As described in the OECD's Handbook on Measuring the Space Economy, measuring economic impacts in the space sector is a challenging task, as there is no single industrial classification for space activities. In order to overcome this difficulty, a model was developed jointly by the CSA and Innovation, Science and Economic Development Canada (ISED) to calculate the space sector's contribution to GDP (gross domestic product or value added). This process involved taking into account the various industrial classifications, weighing them and categorizing them using a value-chain approach, in order to develop a set of multipliers based on Statistics Canada's Input-Output tables. These multipliers are used to determine the impacts on GDP and employment of the space sector, the suppliers to the space sector, and the consumer spending by employees associated with both the space sector and its supply industry.
A detailed explanation of the Economic Impact Model follows:
- North American Industry Classification System (NAICS) codes were retrieved for each space company through Statistics Canada's Business Register. This exercise generated a list of 11 separate industrial classifications that covered all active Canadian space sector companies.
- Canadian space companies were categorized into a value-chain model based on the goods and services they provide: Research, Engineering and Consulting Services; Manufacturing; Satellite Operations; Service Providers; and Broadcasting Services.
- Universities, research centres and associations were grouped together under Research, Engineering and Consulting, as in most cases their space sector activities are related to R&D.
- The grouping of NAICS codes in each of the value-chain categories were then weighted for their relative importance within that particular category. Weighting was established on the basis of workforce tied to each NAICS code. The more workforce associated with organizations in a particular NAICS code, the heavier that NAICS code was weighted relative to the grouping of NAICS codes in that value-chain category.
- Customized economic multipliers were then built for each value-chain category based on Statistics Canada's input-output accounts for existing NAICS codes. These multipliers are at three levels: space sector, supply industry and consumer spending by associated employees.
- Employment levels for each value-chain segment of the space sector (collected directly from companies through the questionnaire) are entered in the Economic Impact Model. The customized economic multipliers are then applied to generate the space sector's total GDP and workforce impact numbers.
The "multiplier effect
" refers to the total impacts (space sector, supply industry and consumer spending by associated employees) divided by the initial space sector impact. This gives the reader an idea of the impact that one job or one dollar in the space sector has on the wider economy.
Note: Two types of primary inputs can be used in an input-output model: revenues or employment. Employment has been chosen here, as it provides a more accurate portrait of the true level of economic activity being performed within Canada's borders. The results of this analysis can be considered a conservative estimate of Canada's space sector impact, particularly when compared to third-party studies or comparative international reports, which may use different methodologies.
Highly Qualified Personnel and STEM Workforce
New for the survey, highly qualified personnel (HQP) is defined as the number of space-related employees who have at least a bachelor's degree. This definition aligns more closely with Statistics Canada's definition of HQP, enabling comparisons with other sectors of the economy.
STEM employees are space-related employees involved in science, technology, engineering or mathematics activities. For the purpose of this survey, STEM employees include engineers, scientists, technicians, management, health professionals and students working in the space sector. Management employees are included in the STEM indicator because the vast majority of employees in this category are managing STEM-related activities. Similarly, students were included in this indicator, because the vast majority of students employed by space companies are directly involved in STEM activities. This approach aligns more closely with Statistics Canada's and the OECD's definitions of STEM employees.
C. Annex C Definitions
In this section
Definition of Canada's Space Sector
The Canadian space sector is defined as organizations (private, public and academic) whose activities include the development and use of space assets and/or space data.
Definition of Space Value-Chain Categories
This report uses a methodology developed by the Organisation for Economic Co-operation and Development's Space Forum, of which the CSA is a Steering Committee member, to characterize Canadian space activities on the basis of a value-chain approach. The definitions of space sector categories were updated in the edition of this report as per the value-chain approach, with findings presented on the basis of upstream and downstream segment activities. This re-categorization is intended to improve the measurement of the space sector and enable international comparisons.
Under this value-chain approach, data have been organized into categories that align with the stages of producing space goods and services: Research, Engineering and Consulting; Space Segment Manufacturing; Ground Segment Manufacturing; Satellite Operations; Products and Applications; and Services. This approach replaces the space categories used in the annual State of the Canadian Space Sector Reports from to .
Upstream Segment
The upstream segment refers to the effort required to design, test, build, integrate, and launchFootnote 2 assets into space.
- Research, Engineering, Testing and Consulting: Research and development (R&D) related to non-commercial or pre-commercial activities; applied science; design and testing of spacecraft, satellites and payloads or components thereof; support services directed at enabling other space sector actors throughout the value chain, including outreach activities, legal services, insurance provision, market research, policy and management services.
- Space Manufacturing: Building and integration of spacecraft, satellites, payloads or any component thereof.
- Ground Manufacturing: Building and integration of facilities and equipment on Earth for satellite operations, often known as "
ground stations.
"
Downstream Segment
The downstream segment refers to the effort required for the day-to-day operation of space assets, manufacturing of products and software applications that transform space data and signals into useful end products, and services provided to end-users.
- Satellite Operations: Day-to-day management of satellites and spacecraft once they are in space, e.g. telemetry, tracking and command; monitoring, recovery operations and collision avoidance; mission planning for satellite passes; uplinks and downlinks for signal processing to reception facility; lease or sale of satellite capacity.
- Products and Applications: Manufacturing/development of software or hardware that enable the transformation of space-derived resources into a usable/useful format, e.g. computer software applications, chipsets, Very Small Aperture Terminals and other terminals, antennas, satellite phones, video and audio receivers-decoders, and GPS devices. This category also includes publishing digital or print books, atlases and maps using space-based data.
- Services: Provision of services which are dependent on space-based signals or data to various end-users (individual consumers, government departments, or businesses), e.g. subscriptions to satellite radio, phone, television or Internet services; engineering, architectural and environmental consulting based on the processing and analysis of Positioning, Navigation and Timing (PNT) or Earth Observation (EO) data; support services provided to users of space-based products and applications, such as provision of computer consulting and facilities management, data processing, Web hosting and portals, and streaming services.
Definition of Sectors of Activity
The activities of space organizations can also be broken down, as has been done in previous reports, according to the ultimate use or purpose of the research carried out or the goods and services produced. Space sector activities can serve commercial, civil or military purposes, and refer to activities across the value chain:
- Navigation: The development and use of satellites for localization, positioning and timing services. Navigation is used for air, maritime and land transport, or the localization of individuals and vehicles. It also provides a universal referential time and location standard for a number of systems.
- Satellite Communication: The development and use of satellites to send signals to Earth for the purpose of fixed or mobile telecommunications services (voice, data, Internet, and multimedia) and broadcasting (TV and radio services, video services, Internet content).
- Earth Observation (EO): The development and use of satellites to measure and monitor Earth (including its climate, environment and people) for a number of purposes such as resource management, mineral exploration, disaster assessment, security and defence.
- Space Exploration: The development and use of manned and unmanned spacecraft (space stations, rovers and probes) to investigate the reaches of the universe beyond Earth's atmosphere (e.g. the Moon, other planets, asteroids). The International Space Station and astronaut-related activities are considered in this sector.
- Space Science: The various science fields that relate to space flight or any phenomena occurring in space or on other planets (e.g. astrophysics, planetary science, space-related life science).
- Other: Generic technologies or components that are not destined for use on a specific space system or for a specific space application. This could be the case for early-phase research, small off-the-shelf components used in various systems, or services based on integrated applications.
The State of the Canadian Space Sector Report provides insight for decision makers in government and industry to help make informed, strategic choices for the future.
Canadian Space Agency
John H. Chapman Space Centre
6767 Route de l'Aéroport,
Saint-Hubert, Quebec J3Y 8Y9
Canada
www.asc-csa.gc.ca