
Evaluation of the Earth Observation Business Line of the Canadian Space Agency
For the period from to
Project #15/16 – 02-02
Prepared by the Audit and Evaluation Directorate
Table of contents
List of tables and figures
- Table 1 EOBL expenditures by fiscal year by sub-sub-program
- Table 2 EOADP impacts as per survey respondents
- Table 3 Yearly overhead rate, –
- Table 4 Government departments and agencies areas of interest
- Figure 1 Total federal departmental and agency use of SAR imagery, –
- Figure 2 Total RADARSAT-2 acquisitions and archived SAR imagery use, –
- Figure 3 Flow chart
- Figure 4 Planned vs Actual expenditures, –
- Figure 5 Distribution of total actual expenditures by SSP from to
Acronyms used in the report
- AAFC: Agriculture and Agri-food Canada
- AIS: Automated Identification System
- AOI: Area of Interest
- CCMEO: Canada Centre for Mapping and Earth Observation
- CIS: Canadian Ice Service
- CSA: Canadian Space Agency
- DFO: Fisheries and Oceans Canada
- DND: Department of National Defence
- DUAP: Data Utilization Application Plan
- ECCC: Environment and Climate Change Canada
- EMOC: Enhanced Management of Orders and Conflicts
- EO: Earth Observation
- EOADP: Earth Observation Application Development Program
- EOBL: Earth Observation Business Line
- EODIU: Earth Observation Data and Imagery Utilization
- EODMS: Earth Observation Data Management System
- ESA: European Space Agency
- FTE: Full-time Equivalent
- FTP: File Transfer Protocol
- G&Cs: Grants and Contributions
- GoC: Government of Canada
- GRDS: Government RADARSAT Data Services
- GRIP: Government Related Initiatives Program
- IIRB: Integrated Investment Review Board
- IMOU: Internal Memorandum of Understanding
- INAC: Indigenous and Northern Affairs Canada
- InSAR: Interferometric Synthetic Aperture Radar
- IRO: Independent Review and Oversight
- ISTOP: Integrated Satellite Tracking of Pollution
- IT: Information Technology
- MDA: MacDonald, Dettwiler and Associates
- MOU: Memorandum of Understanding
- MSOC: Maritime Security Operations Centre
- NASA: National Aeronautics and Space Administration
- NEODF: National Earth Observation Data Framework
- NRCan: Natural Resources Canada
- O&M: Operations and Maintenance
- PAA: Program Alignment Architecture
- PC: Parks Canada
- PM Strategy: Performance Measurement Strategy
- PSEP: Public Safety and Emergency Preparedness Canada
- RCM: RADARSAT Constellation Mission
- RPP: Report on Plans and Priorities
- SAR: Synthetic Aperture Radar
- SOAR: Science and Operational Applications Research
- SSP: Sub-Sub-Program
- StatCan: Statistics Canada
- TC: Transport Canada
- TT&C: Telemetry, Tracking and Command
- U&ST: User and Science Team
- VASP: Value-added Service Provider
Executive summary
The Evaluation of the Earth Observation Business Line (EOBL) of the Canadian Space Agency (CSA) was commissioned in by the Audit and Evaluation Directorate in accordance with the requirements of the Financial Administration Act and the Five-Year Departmental Evaluation Plan. The evaluation undertaken by Science-Metrix Inc. focussed on the five core issues identified in the Treasury Board of Canada Secretariat's Directive on the Evaluation Function (), which included issues of relevance and performance. The evaluation focussed on the achievement of the EOBL's outcomes, and not on the design and delivery of each of the EOBL's activity and output. The scope of the evaluation also included a mid-term review of the design and delivery to date of the RADARSAT Constellation Mission (RCM) to fulfill funding approval commitments and senior management's information needs. The timeframe of the evaluation covered the period from to during which time total disbursements amounted to over $700 million.
Program description
Earth observation (EO) has been an increasingly important component of the CSA's space program since the launch of the RADARSAT-1 mission. From until , RADARSAT-1 provided operational service to government and commercial users worldwide through a network of ground receiving stations. It gave Canada a world leadership position in space-borne Synthetic Aperture Radar (SAR) systems. This leadership was maintained with the launch of the state-of-the-art RADARSAT-2 satellite in , now surpassing its estimated design lifespan to . Approval to build, test and launch the RCM was received in and is expected to launch as planned in . Canadian and international users of RADARSAT SAR data and imagery (government, academia, and industry) have had an uninterrupted supply for more than 20 years. With an estimated design lifespan of 7 years, RCM will ensure SAR data availability so that current users can make substantial long-term investments in systems, procedures and applications in order to incorporate SAR imagery into their day-to-day operations.
Relevance
Over the period covered by this evaluation, the EOBL has largely been responsive to the federal government priorities and those of the CSA by aligning the outcomes of the EOBL and the design of the RCM with the needs of federal government departments and agencies. The EOBL provides government departments and agencies with access to SAR data and imagery for the development of space-based solutions to help them deliver on their mandates that contribute directly or indirectly to the prioritized national issues. Evaluation findings thus indicate that the CSA's role in designing, launching and operating EO missions for the provision of SAR data, data handling, and promoting data and imagery utilization is very appropriate.
The EOBL support for Canadian private sector involvement in EO-related space-mission development generated significant direct economic benefits. Canadian EO value-added space companies and academia were also involved in application development programs mostly to support innovation and application development for use by the federal government. As the EO technology matures, there is opportunity for the EOBL to further support academia and the development and competitiveness of the value-added space industry. Government departments and agencies, academia and the private sector are using multiple sources of EO data from foreign satellites to generate space-based solutions and there is a tendency in many countries towards open data initiatives. Reviewing the EOBL program outcomes in a manner that is inclusive of the needs and interests of all stakeholders for a variety of EO data would ensure that the EO sector evolves with current global trends.
Therefore, the evaluation recommends that:
Considering that the Treasury Board Policy on Results requires departments to develop their Departmental Results Framework and Program Inventory, the CSA should seize the opportunity to review its EO program outcomes in order to appropriately reflect the range of EO stakeholders in Canada and respond to their needs by providing access to a variety of EO data, including data from foreign satellites.
Achievement of outcomes
The EOBL has achieved its outcomes by providing government departments and agencies with a continuously increasing quantity of high-quality data and imagery, and supporting them in the development of space-based solutions. SAR data and imagery has been invaluable in achieving cost savings for departments. The increase in RADARSAT imagery users has amplified the potential for conflicts over new acquisitions, which was partly resolved by the implementation of the Enhanced Management of Orders and Conflicts (EMOC) for user departments; data acquisition conflicts remain a challenge among the value-added space industry and academia stakeholders. The use of archived imagery has increased during the period covered by the evaluation and users are highly satisfied with the online catalogue of archived images. Standard coverage, combined with improved valorization and accessibility to archived RADARSAT images would enable to further support the value-added space industry and academia stakeholders to have greater access to SAR imagery, and provide an effective way to reuse imagery for multiple purposes, such as research and the development of new applications.
The EOBL has been effective in the development of applications to support government departments and agencies to deliver on their mandates and the EOBL's funding and imagery supply programs have been instrumental in building departmental users' capacity. However, there is still a need to give the value-added space industry a greater role in providing services for the development of applications in response to the needs of emerging user departments to further build their capacity. In addition, the value-added space industry supported by the EOBL has shown a great return on investment with the commercialization of half of the projects surveyed as part of this evaluation. The revision of the funding model could further enhance the commercial benefits of the EOBL.
Therefore, the evaluation recommends that:
The CSA enhances the effectiveness of the applications program by reviewing its design and funding options to better support building EO data departmental user capacity and developing a competitive EO value-added space industry in Canada.
Efficiency and Economy
The EOBL has been managed in an economical and efficient manner using internal management controls and various business models to suit the Canadian context. The EOBL's funding programs have been a highly efficient way to support data utilization by providing imagery to government department and agency, the private sector, and academia through a variety of funding and imagery supply mechanisms. Also, the CSA has managed to keep the RCM on track to meet its deadline.
With respect to performance measurement tools and systems, currently decentralised within the EOBL, the evaluation has identified opportunities for improvement with the aim of producing adequate performance measurement data to support the evaluation function and senior management decision-making. Due to the nature of its activities, the EOBL's outcomes focus on federal government achievements, making it challenging to measure and report on results. Improving coordination between the EOBL's programs for more streamlined and coordinated reporting requirements would ease the burden on government user departments and agencies.
Therefore, the evaluation recommends that:
The EOBL performance measurement mechanisms and tools be redesigned and operationalized in a more coordinated manner centralized within the EOBL, with the objective of generating accessible and useful performance data to support the evaluation function and senior EOBL management.
1. Introduction
The mandate of the Canadian Space Agency (CSA) is "to promote the peaceful use and development of space, to advance the knowledge of space through science and to ensure that space science and technology provide social and economic benefits for Canadians."Footnote 1
Established in , with a status equivalent to that of a Department of the Government of Canada (GoC), the CSA is responsible for the coordination and implementation of space policies and programs, the application and diffusion of space technology and the promotion of commercial exploitation of space. Earth observation (EO) has been an increasingly important component of the CSA's space program since the launch of the RADARSAT-1 mission.
The CSA Audit and Evaluation Directorate commissioned the services of Science-Metrix to undertake an Evaluation of CSA's Earth Observation Business Line (EOBL), as per the Five-Year Departmental Evaluation Plan and in accordance with the Treasury Board of Canada's Policy on Evaluation (). The evaluation assessed the issues of relevance and performance (effectiveness, efficiency and economy), from to .
2. Background
2.1 Program profile
In the 1980s, Canada's pioneering Synthetic Aperture Radar (SAR) technology, deployed in aircraft, captured images of Canada and parts of Africa. These technological advances were then integrated into spaceflight hardware that was flown by the European Space Agency (ESA). Having attained space flight heritage, Canada launched its own Earth observation RADARSAT-1 satellite in , with the primary requirement to manage navigation through Canada's ice-bound waters. Operating independent of daylight or weather conditions, the satellite's SAR sensor provided global coverage of the Earth's surface, making it a useful sensor for monitoring Canada's changing landmass and coastal zones.
From until , RADARSAT-1 provided operational service to both government and commercial users worldwide through a network of ground receiving stations. It gave Canada a world leadership position in EO space-borne SAR systems. This leadership was maintained with the launch of the state-of-the-art RADARSAT-2 satellite in , with an estimated design lifespan to . With RADARSAT-2 still in operation, Canadian and international users of RADARSAT SAR data and imagery (government, academia, and industry) have had an uninterrupted supply for more than 20 years.Footnote 2
In , the RADARSAT Constellation Mission (RCM) received approval-in-principle to develop a three-satellite radar constellation to support the operations of public and private users. The RCM's approval to begin Phase D to build, test and launch RCM by was received in , followed by the Mission's Critical Design Review, which was completed in for Phase C. The RCM's expected lifetime is 7 years to ensure SAR data availability so that current users can make substantial long-term investments in systems, procedures and applications in order to incorporate SAR imagery into their day-to-day operations.
Federal government user departments and agencies have been using space-borne SAR imagery in a wide range of areas, including environmental monitoring, marine surveillance, land mapping and agriculture. The GoC has been increasingly using EO data as part of its efforts to maintain Canada's sovereignty and security and ensure the responsible development and management of northern resources in the context of the opening of the Northwest Passage in the Arctic.
In , the GoC released Canada's Space Policy Framework, a new policy framework to address these opportunities and emerging needs. This framework sets out five principles, along with four areas of action that serve as a guide to Canada's strategic activities and future in space. The EOBL aligns with Canada's Space Policy Framework. The three main EOBL stakeholder groups are
- federal government departments and agencies,
- space industry organizations, and
- the academic community.
Other stakeholders include international space agencies, such as the US National Aeronautics and Space Administration (NASA) and ESA, who are both partners and clients for EO data, as well as the general public indirectly.
2.2 Governance, roles and responsibilities
A number of governance boards are responsible for the decision-making processes of GoC space investments, including EO investments for space utilization.Footnote 3
Interdepartmental Space Governance:
- The Deputy Minister Governance Committee for Space is a whole-of-government body established to ensure alignment of the space program with government priorities and mandates.
- Two integration boards at the Assistant Deputy Minister and Director General levels are responsible for ensuring the coordination of space-related investments to eliminate any overlap of objectives and resources, through the establishment of a whole-of-government approach to user needs and requirements.
CSA Internal Governance:
- The Executive Committee of the CSA is the official decisional body of the Agency. As such, it is responsible for the governance of programs and activities, as well as for the delegation of spending authority within the CSA. Under the provisions of its mandate, the Executive Committee is responsible for the overall management, monitoring and control of CSA activities.
- The mandate of the Integrated Investment Review Board (IIRB) is to provide the sound stewardship necessary to ensure that CSA's investments are made and monitored to achieve value for money and expected program results. Decisions made by the IIRB pertain to allocation and re-allocation of resources, investment and project management processes, project gating and reporting on plans, programs and results.
- The Policy and Strategy Board's mandate is to ensure that the CSA has a coherent policy agenda and well-designed policies and strategies that are aligned with other relevant domestic and international policies and support the space-related objectives of the GoC.
The RCM is a Major Crown Project, and as such it requires funding approval at the Cabinet level and authorization from the Treasury Board to access funds. Any major changes to the scope of such projects require Treasury Board and/or Cabinet approval. Other EOBL projects are overseen and managed by several governance structures at various levels.
2.3 Program theory
The EOBL falls within the Space Data, Information and Services Program (1.1), which aims to achieve the strategic outcome of "Canada's exploration of space, provision of space services and development of its space capacity meet the nation's needs for scientific knowledge, innovation and information." The EOBL's stated ultimate outcome is that "The GoC offers more diversified or cost-effective programs and services due to their utilization of space-based solutions." The EOBL is composed of four sub-sub-program (SSP) elements of CSA's Program Alignment Architecture (PAA), each of which is described below.
- Earth Observation Missions (SSP 1.1.1.1) encompasses the definition, design, technology development, and implementation of Earth orbit satellites dedicated to producing data, information or imagery of Earth and its atmosphere.
- Satellite Operations (SSP 1.1.2.1) encompasses the Telemetry, Tracking and Command (TT&C) of Canadian satellites or of foreign satellites when such services are required from Canadian ground stations.
- Data Handling (SSP 1.1.2.2) coordinates a national approach to determine optimal station locations and space-borne SAR data and imagery handling.
- Earth Observation Data and Imagery Utilization (SSP 1.1.3.1) develops products, systems and applications for EO imagery. The participation of the federal government, the Canadian space industry and academic community is encouraged through the following funding and imagery supply channels:
- The Government Related Initiatives Program (GRIP) provides financial and technical support to federal government departments and agencies;
- The Earth Observation Application Development Program (EOADP) provides financial support and imagery accessibility to Canadian private sector organizations;
- The Science and Operational Applications Research (SOAR) provides RADARSAT imagery accessibility to Canadian and international academic institutes and researchers as well as financial support to Canadian post-secondary institutions; and
- The Data Utilization Application Plan (DUAP) provides a framework for the activities, management and resources that will be supported by the RCM project to help with the operational readiness of federal government department and agency users of the RCM data and imagery in time for the system commissioning scheduled in , as well as optimal use thereafter. The DUAP financial resources are part of the overall RCM budget.
The EOBL logic model (Appendix A) identifies the linkages between the activities described above and the achievement of outcomes.
2.4 Resource allocation
The CSA's annual A-Base budget of $300 million was initially established in Budget ($215.4 million in dollars), and is now in the order of $260 million. The EOBL share of those expenditures has varied from year to year but has been generally on an uptrend; it is now at +50% as the RCM begins to disburse in Phase D on manufacturing, assembly, integration and testing. Actual expenditures for the fiscal years covered by this evaluation by SSP are presented in Table 1 below.
| Sub-Sub-Program | – Actual Expenditure |
– Actual Expenditure |
– Actual Expenditure |
– Actual Expenditure |
–Footnote 4 Actual Expenditure |
|---|---|---|---|---|---|
| Earth Observation Missions: (Sub-Sub-Program 1.1.1.1) | |||||
| Salaries | 3,925,118 | 4,109,825 | 5,565,537 | 6,623,525 | 7,151,337 |
| O&M | 2,542,139 | 1,647,867 | 705,076 | 4,071,716 | 1,798,219 |
| Capital | 90,523,336 | 92,483,781 | 171,276,943 | 127,367,215 | 153,772,139 |
| G&Cs | 0 | 0 | 0 | 318,644 | 649,870 |
| Sub-Total Sub-Sub-Program 1.1.1.1 | 96,990,592 | 98,241,474 | 177,547,555 | 138,381,100 | 163,371,565 |
| Satellite Operations (EOBL portion): (Sub-Sub-Program 1.1.2.1) | |||||
| Salaries | 2,298,977 | 2,151,609 | 1,984,094 | 1,962,289 | 1,725,941 |
| O&M | 3,692,016 | 2,945,139 | 1,590,275 | 1,092,994 | 3,082,082 |
| Capital | 263,530 | 746,492 | 1,203,155 | 1,065,259 | 1,639,394 |
| G&Cs | 0 | 0 | 0 | 0 | 0 |
| Sub-Total Sub-Sub-Program 1.1.2.1 | 6,254,523 | 5,843,241 | 4,777,524 | 4,120,542 | 6,447,417 |
| Data Handling (EOBL portion): (Sub-Sub-Program 1.1.2.2) | |||||
| Salaries | 82,289 | 95,662 | 44,103 | 98,486 | 140,531 |
| O&M | 1,772,884 | 1,456,753 | 624,647 | 243,204 | 240,559 |
| Capital | 0 | 0 | 0 | 0 | 0 |
| G&Cs | 0 | 0 | 0 | 0 | 0 |
| Sub-Total Sub-Sub-Program 1.1.2.2 | 1,855,173 | 1,552,415 | 668,751 | 341,690 | 381,090 |
| Earth Observation Data and Imagery Utilization: (Sub-Sub-Program 1.1.3.1) | |||||
| Salaries | 1,938,126 | 1,349,638 | 1,131,487 | 1,295,224 | 1,103,867 |
| O&M | 10,522,593 | 7,655,960 | 6,422,709 | 7,502,373 | 14,402,037Footnote 5 |
| Capital | 61,999 | 0 | 0 | 0 | 0 |
| G&Cs | 50,000 | 145,500 | 69,554 | 1,208,284 | 1,380,690 |
| Sub-Total Sub-Sub-Program 1.1.3.1 | 12,572,718 | 9,151,098 | 7,623,750 | 10,005,881 | 16,886,594 |
| Total EOBL | 117,673,006 | 114,788,227 | 190,617,580 | 152,849,213 | 187,086,666 |
Source: CSA Finance Directorate, . Due to rounding, amounts may not sum exactly to totals.
2.5 Prior evaluation of the Program
No previous formal evaluations of the EOBL have been undertaken. The latest evaluation of the Earth Observation Data and Imagery Utilization Program (SSP 1.1.3.1) was conducted by CSA in .Footnote 6 An Evaluation of the RADARSAT-2 Major Crown Project concluded in .Footnote 7
3. Evaluation approach and methods
3.1 Purpose and scope
The Evaluation of CSA's EOBL is in keeping with the requirements stipulated in the Treasury Board's Policy on Evaluation () and the Financial Administration Act.
The evaluation addressed the period from to . The scope of the EOBL evaluation included four SSPs of CSA's PAA. The evaluation focussed on the achievement of the EOBL's immediate, intermediate and ultimate outcomes, as defined in the logic model, and not on the design and delivery of each of the EOBL's activity and output. Embedded within this evaluation is a mid-term evaluation of the RCM implementation progress to date to fulfill its funding approval commitments. This mid-term evaluation encompasses activity from the early definition and design phases A, B and C, to the current manufacturing, assembly, integration and testing of Phase D.
3.2 Evaluation issues
The evaluation examined the relevance and performance of the EOBL using the five core issues identified in the Treasury Board's Directive on the Evaluation Function: alignment with government priorities, alignment with federal roles and responsibilities, continued need for the program, achievement of expected outcomes, and demonstration of efficiency and economy. The 16 questions addressed by the evaluation are listed below:
Relevance
- Did the EOBL outcomes align with GoC priorities for science, technology and innovation and the Canadian space sector?
- Did the CSA assume appropriate roles and responsibilities with its delivery partners for the EOBL program activities?
- Has there been a change in the demand for SAR imagery from federal government departments and agencies?
- Has the EOBL accurately identified the needs of its current federal government user departments and agencies for SAR data and imagery?
- Has the EOBL addressed the interests and needs of its other stakeholders for involvement in EO-related space utilization development?
Performance
- To what extent have EO RADARSAT missions achieved their immediate and intermediate outcomes?
- To what extent has Ground Infrastructure achieved its immediate and intermediate outcomes?
- To what extent has EO Data and Imagery Utilization achieved its immediate and intermediate outcomes?
- To what extent has the EOBL achieved its ultimate outcome?
- To what extent has the EOBL created opportunities for private sector organizations to develop and commercialize new EO products and services?
- Have there been any unintended outcomes attributable to the EOBL?
- Has the EOBL been managed in an efficient manner?
- Has the EOBL been managed in an economical manner?
- Are there alternative delivery models that would be more efficient or economical?
- Is the RCM on track to achieve key milestones, remain within budget and fulfill users' requirements as planned?
- Has the EOBL Performance Measurement (PM) Strategy facilitated the selection, development and use of performance measures for management decision making and evaluation?
3.3 Methods
3.3.1 Documentation review
An analysis of the content of internal and external documents was conducted to position the EOBL within a broad reference of operation; the review considered the Canadian and international contexts, and primarily provided details on relevance issues, as well as contextual information for assessing outcome achievement. The evaluation reviewed 122 internal and external documents including internal documents provided by the CSA, policy documents, and peer-reviewed papers.
3.3.2 Performance and financial data
The financial, administrative and performance data review included an analysis of related quantitative data collected and reported by the EOBL over the evaluation time frame and provided insight primarily on performance (i.e., economy, efficiency and effectiveness). The evaluation looked at a variety of performance data collected by SSPs, as part of the EOBL PM Strategy and the CSA Performance Measurement Framework. The financial data were provided by the CSA Finance Directorate.
3.3.3 Key informant interviews
In-depth key informant interviews were undertaken with CSA staff and government user departments and agencies to provide further insight on the issues of relevance and performance. Of the 15 departments using SAR data and imagery, the evaluation team undertook group or individual interviews with 13 departments and a total of 22 staff members, who were supplied with tailored interview guides. Interviews were conducted with 10 CSA staff to gain insight into the EOBL delivery internally at the CSA.
3.3.4 User department and agency profiles
User department and agency profiles were developed to showcase user departments' current and future needs and capacity with respect to the use of SAR imagery. Data from the interviews, surveys, and performance and documentation reviews were compiled to provide an overview of the selected departments and agencies. The following departments and agencies were selected in collaboration with the evaluation project authority: Natural Resources Canada (NRCan), Parks Canada (PC), Public Safety and Emergency Preparedness Canada (PSEP), Transport Canada (TC), and Indigenous and Northern Affairs Canada (INAC).
3.3.5 E-surveys
The evaluation team conducted two e-surveys to gain input from SOAR and EOADP recipients. The EOADP e-survey was launched on and closed on . The EOADP funded 59 projects with 21 private sector stakeholders over the evaluation time frame. The survey was sent to the 21 companies to request information on all their funded projects; 16 respondents provided information on 41 projects, giving the survey a 70% response rate. The SOAR e-survey was launched on and closed on . It was sent to 211 national and international SOAR recipients and 87 completed surveys were returned, for a response rate of 41%. The SOAR survey included questions specifically targeting the 43 out of the 211 SOAR recipients who had not used their data allocation to gain a better understanding of the lack of SAR imagery uptake; only 8 of these 43 recipients responded (19%), with varied responses.
3.3.6 Telephone survey
The evaluation team also undertook telephone survey interviews with GRIP recipients, as well as other departmental researchers, to gain insight on the progress of their projects. GRIP funded 60 projects over the evaluation time frame, and 25 recipients were reached via telephone survey. The evaluation team developed an Excel spreadsheet for data gathering based on key questions.
3.3.7 Case studies
Case studies were also used to provide more in-depth information on the data utilization programs. Three case studies were selected in collaboration with the CSA evaluation project authority, examining one recipient from each of the SOAR, GRIP and EOADP programs. The case studies are as follows:
- GRIP: Fisheries and Oceans Canada (DFO), Canadian Hydrological Service, Charting Service
- EOADP: 3vGeomatics, Permafrost
- SOAR: University of Waterloo, Lake ice monitoring
3.4 Limitations
The limitations to this evaluation pertain to performance data. There were very limited consistent performance data that spanned the – timeline of the evaluation, due to changing performance indicators. The only main data source that spanned the timeline of the evaluation was the Government RADARSAT Data Services (GRDS), which provided RADARSAT-2 SAR imagery usage by department per year for CSA ground stations. The performance data on acquisition will therefore only focus on SAR imagery usage from RADARSAT-2 for consistency purposes. Nonetheless, a robust set of evidential data was successfully compiled to conduct the EOBL's evaluation.
4. Results
4.1 Relevance
This section presents the results for the relevance evaluation issue, providing the findings from the following evaluation issues: alignment with federal priorities, alignment with federal roles and responsibilities, and continued need for the program.
4.1.1 Alignment with federal priorities
Evaluation question (Relevance) 1: Did the EOBL outcomes align with GoC priorities for science, technology and innovation and the Canadian space sector?
Finding #1: As set out in CSA's PAA, the EOBL logic model outcomes have aligned primarily with the federal government priorities to access SAR data, imagery and space-based solutions to help government departments deliver on their mandates. The EO community, which includes the value-added space industry, is identified in the EOBL logic model as a means to support innovation and application development for use by the federal government.
In , the GoC released the Canadian Space Policy Framework, which provides a comprehensive approach to Canada's future in space. The EOBL has aligned with the Space Policy Framework, with a primary focus on meeting the needs of "Canadian interests first"; the Framework states that "National sovereignty, security and prosperity will be the key drivers of Canada's activities in space."Footnote 8 The document review found that the EOBL expected outcomes, established prior to the release of the Space Policy Framework, align with the Framework and provide government departments and agencies with access to SAR data and imagery for the development of space-based solutions to help them deliver on their mandates that contribute directly or indirectly to the prioritized national issues. As set out in its PAA, the CSA directed its investments towards government requirements and focussed on enhancing the RADARSAT missions, with the development of the RCM and the implementation of related coordinated ground infrastructure, and on developing applications for government departments and agencies.Footnote 9
Other mechanisms planned in the Space Policy FrameworkFootnote 10 included the Deputy Minister Governance Committee for Space to ensure effective oversight, accountability and decision-making on major multi-departmental space projects,Footnote 11 such as the RCM, as well as two boards composed of senior executives from federal departments and agencies involved in science-based activities to oversee the "whole-of-government prioritization, sequencing and rigorous program management of space asset development and utilization."Footnote 12 The change from a privately owned satellite for RADARSAT-2 to a government-owned satellite for the RCM, further supports the CSA's alignment with meeting government departments' and agencies' needs.
Regardless of the release of the Space Policy Framework, the document review found that from to , the Canadian Space Program did not benefit from an updated long-term strategic direction for space development or guidance for EO activities, despite the emerging EO trends and increasing use of SAR data and imagery. The interview data documented that the absence of an EO strategy made it challenging for the CSA to prioritize needs and investments with its limited resources. The document review found that to meet needs across government departments and agencies, other countries have been establishing national, cross-departmental space policies and coordination structures, as well as stakeholder-driven advisory bodies to inform national space-related priority-setting.Footnote 13
The Space Policy Framework followed the recommendation of the Aerospace ReviewFootnote 14 and committed to establishing a Canadian Space Advisory Board, chaired by the President of the CSA and composed of representatives of the public and private space sectors.Footnote 15 The CSA announced the creation of this board for –, among other mechanisms aimed to "ensure that all pertinent partners and stakeholders are consulted in setting the Government's future priorities in space, and to provide clear oversight and accountability in its investments."Footnote 16 As announced at the Canadian Aerospace Summit by the Minister of Innovation, Science and Economic Development, the Space Advisory Board was officially revitalized in with a mandate to consult stakeholders to define the key elements of the forthcoming space strategy.Footnote 15 As per the Minister's words, the space strategy "will focus on using space to drive broader economic growth … by supporting talent, research and entrepreneurship within the industry."Footnote 17 The federal government is as well currently working on a federal EO strategy that will provide a framework for federal investments in EO operational capabilities.
The EOBL focus on application development and launching the RCM is aligned with science, innovation and technology priorities. The document review found that the CSA had aligned its activities with the federal government's Science and Technology Strategy by supporting industry development through specialization and acquiring expertise in manufacturing the goods required for the RCM and by developing opportunities for data utilization.Footnote 18 These activities continue to be aligned with the Science, Technology, and Innovation Strategy by encouraging Canada's business innovation.Footnote 19 The case studies have shown that the support provided through the SOAR, GRIP and EOADP imagery supply/funding opportunities resulted in supporting the EOBL immediate outcome of "development of new ideas and enhance the ability to turn EO data into products," by developing products for government departments and agencies. In addition to supporting operational needs, the interview data indicated that the EOBL was aligned with science priorities by focusing the initial stages of SAR data innovation on science and research needs, and then progressively supporting application development from onward.
As it has been the case in other countries in recent years, the document review found that the CSA could further enhance its support to the value-added space industry. The EOBL logic model and theory of change, established prior to the Space Policy Framework, could more fully reflect the Framework's commitment to "provide the support to ensure that the domestic space industry is robust and globally competitive."Footnote 20 Such commitment could as well be translated into the EOBL priorities in the CSA Reports on Plans and Priorities (RPPs), which was not the case in recent years. Furthermore, the EOBL expected outcomes could more directly reflect the CSA's key responsibilities to "promote the transfer and diffusion of space technology to and throughout Canadian industry" and to "encourage commercial exploitation of space capabilities, technology, facilities and systems."Footnote 21 Over the years, great support was provided for the development of the Canadian space industry, largely through the design and build of the RADARSAT missions. Although the EOADP does provide financial support and imagery accessibility to the value-added space industry, the program is primarily used, as per the EOBL logic model, as a means to support innovation and application development for use by the federal government. As illustrated in the EOBL logic model and theory of change, the EO community, which includes the value-added space industry, is targeted by the EOBL to "generate new ideas and enhance its ability to turn EO data into usable products and services", which in turn are used by GoC organizations to deliver on their mandate.
4.1.2 Alignment with CSA priorities
The CSA's strategic outcome states that "Canada's exploration of space, provision of space services and development of its space capacity meet the nation's needs for scientific knowledge, innovation and information."Footnote 22 Since , one of the CSA's three main goals has been to help government departments and agencies develop and use space-based solutions so that they offer more cost-effective programs and services that will help fulfill national priorities, including "sovereignty, defence, safety and security, resource management, environmental monitoring and the North."Footnote 23 The document review found that the EOBL expected outcomes are aligned with CSA priorities, which along with the PAA have remained largely unchanged between and . The four SSPs comprising the EOBL contribute to this strategic outcome by fostering an "expanded use of space data, applications and information by government departments and agencies so that they can better deliver their policy and programs and perform their operational responsibilities effectively."Footnote 23 They do so through constructing and operating satellite systems and ground infrastructure and participating in international space missions "whenever it is a cost-effective way to obtain the data needed to meet (Canada) priorities."Footnote 24 The RCM and development of the related coordinated ground infrastructure are aligned with CSA priorities.
4.1.3 Alignment with federal roles and responsibilities
Evaluation question (Relevance) 2: Did the CSA assume appropriate roles and responsibilities with its delivery partners for the EOBL program activities?
Finding #2: The CSA has fulfilled its role and responsibilities regarding EO missions, ground infrastructure, data handling, and data and imagery utilization.
The EOBL's ultimate outcome is to help government departments and agencies offer "more diversified or cost-effective programs and services due to their utilization of space-based solutions." The document review found that achieving this outcome contributed to fulfilling the CSA's role to "assist departments, boards and agencies of the GoC to use and to market space technology," and to fulfilling the CSA's responsibility to "construct, acquire, manage, maintain and operate space research and development vehicles, facilities and systems."Footnote 21 The interview data illustrate that government departments and agencies view the central role that the CSA plays as appropriate and valuable. The CSA has an ongoing working relationship with the company MacDonald, Dettwiler and Associates Ltd. (MDA) to design, develop and operate satellite missions, a relationship which was viewed as appropriate to support the EO missions SSP.The document review found that by leveraging the assets of government departments and agencies, such as NRCan's Canada Centre for Mapping and Earth Observation (CCMEO) satellite ground infrastructure, the EOBL also complies with the Canadian Space Agency Act requirement to "make use of the services and facilities of departments, boards and agencies of the Government of Canada"Footnote 21 through the Satellite Operations SSP.
The interview data indicated that the CSA's role is limited with regard to ground infrastructure and data reception, including information technology (IT) infrastructure, as most of these activities are undertaken by CCMEO. The partnership is viewed as satisfactory for CCMEO, although the CSA interview data indicated that there would be value in reviewing the partnership between CSA and CCMEO to foster greater efficiency. The interview data supported the view that the CSA's role is highly appropriate in coordinating the data acquisitions requests between users and MDA through the order desk under the Data Handling SSP.
The document review found that the EO Data and Imagery Utilization SSP supported the CSA's role to "plan, direct, manage and implement programs and projects relating to scientific or industrial space research and development and the application of space technology."Footnote 21 The SSP fulfills the CSA's role relating to making grants and contributions in support of research and application development programs, including the EOADP, GRIP and SOAR funding programs. The case studies illustrated that the CSA has had a valuable role in providing access to SAR data and imagery to government departments and agencies, industry and academia.
The CSA has historically been actively involved in international space initiatives, primarily with NASA and ESA. The document review found that the EOBL has carried out its responsibility to "cooperate with the space and space-related agencies of other countries in the peaceful use and development of space."Footnote 21 The CSA contributed to the development of satellite sub-systems and instruments, the provision of data, and participated in international cooperation groups, such as the Group on Earth Observations. This also aligns with the Space Policy Framework priority "Progress through Partnerships" to collaborate with "international partners to pool data for mutual benefit and obtain services and technologies that would otherwise be unavailable."Footnote 21 In exchange for such involvement, the Canadian Space Program has had access to foreign space data to fulfill national priorities, among other benefits. The establishment of the RADARSAT-2 contingency plan is a testament to the CSA's investment in international partnerships.Footnote 25 However, interview data indicated that the increase in SAR imagery use by government departments and agencies, combined with the RADARSAT-2 data policy and allocation credit – established in line with the more commercially-geared nature of the RADARSAT-2 mission–, limited the opportunity for the CSA to accommodate the needs of foreign agencies.
The role of the CSA in accessing other EO data is important for government departments and agencies in order to provide opportunities to access all data types. The document review found that other countries are increasing their focus on international cooperation and partnerships. In addition to, for instance, its participation in the International Charter, Space and Major Disasters, Canada could further enhance its international collaborations in order to optimize the potential for resource sharing.Footnote 25,Footnote 26 The evaluation found extensive evidence that government departments and agencies, academia and the private sector are using multiple sources of EO data from foreign satellites to generate space-based solutions. As the EO sector rapidly evolves, users' needs for more diverse data sources and access to international partnerships are becoming more prevalent, indicating that the CSA could strengthen its engagement with foreign agencies as well as keep abreast of the new stakeholders involved in EO sector.
4.1.4 Continued need for the Program
Evaluation question (Relevance) 3: Has there been any change in the demand for SAR imagery from federal government departments and agencies?
Finding #3: The demand for SAR imagery has continued to increase as departments and agencies moved from research to operational uses with the expansion of current applications and the development of new applications by all user departments.
The document review found that there is a global upward trend in EO data usage.Footnote 27 Global EO data sales totalled more than $1 billion in and are expected to more than double to $2.6 billion by .Footnote 28,Footnote 29 Moreover, 37% of the 531 civilian satellites to be built globally between and will be used for EO purposes.Footnote 30,Footnote 26 Canada is expected to be one of the countries to experience such growth as it moves to meet increasing and diverse data needs, ranging "from monitoring the environment and the opening of Canada's North, to the need for enhanced natural resource management and increased concerns for security and disaster management applications."Footnote 31
There has been an overall upward trend in the number of government departments and agencies using SAR data and imagery from to . The document review confirmed that SAR imagery has largely dominated the Canadian government EO data utilization landscape, with RADARSAT-1 and RADARSAT-2 representing approximately half of the data and imagery usage between and .Footnote 26 The performance data documented that the use of RADARSAT-2 SAR imagery has increased from 10 government departments and agencies in – to 14 government departments and agencies by –, with a total of 15 government departments and agencies using SAR imagery for operational applications and/or research during that time (Figure 1).Footnote 32,Footnote 33 The interview data suggested that the increase in the use of SAR imagery reflects the evolution of the purpose of the RADARSAT mission. Built as an operational mission, RADARSAT-1 data and imagery was used mainly to conduct research. However, in the last five years and with the launch of RADARSAT-2, there has been a push toward more operational applications for SAR data and imagery use. All departmental profiles showed an increase in SAR imagery use over the course of the evaluation period; some departments have been using more archived imagery, while others are increasing their use of new acquisition imagery.
Figure 1 Total federal departmental and agency use of SAR imagery, –
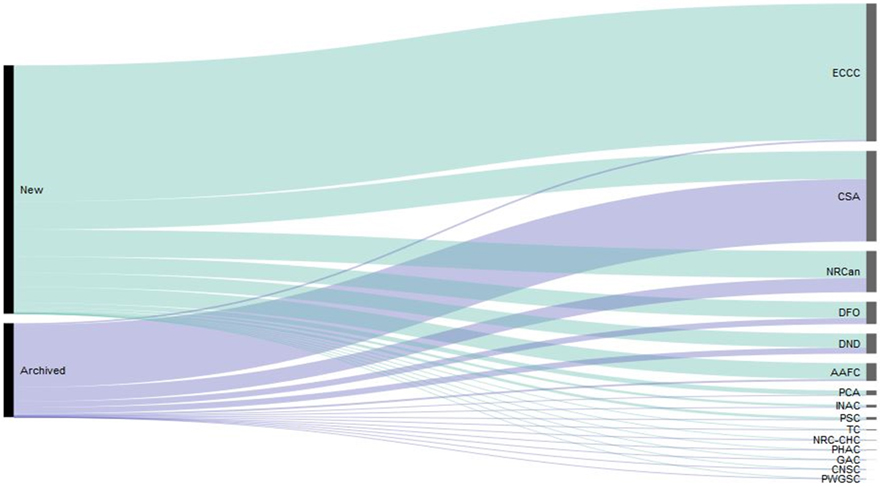
Figure 1: Total federal departmental and agency use of SAR imagery, – - Text version
A diagram displaying the total federal departmental and agency use of SAR imagery between -. The graph depicts the level of utilization in descending order and separated in 2 categories: new and archived imagery.
New imagery:
- ECCC
- CSA
- NRCan
- DFO
- DND
- AAFC
- PCA
- INAC
- PSC
- TC
- NRC-CHC
- PHAC
- GAC
- CNSC
- PWGSC
Archived imagery:
- CSA
- NRCan
- DFO
- DND
- AAFC
- PCA
- INAC
- PSC
- TC
- NRC-CHC
- PHAC
- GAC
- CNSC
- PWGSC
Note: Full Department of National Defence (DND) data are not included as they do their own SAR data processing to generate SAR imagery. These data were not included in the GRDS End of Year reports.
Source: GRDS End of Year reports – to –
The transition from research to operational use of SAR imagery increased the overall demand and provided opportunities to diversify applications. The document and performance data identified 84 government or agency programs and SSPs using SAR data and imagery for a variety of applications.Footnote 34 The use of SAR imagery evolved from applications for ice and marine security, to broader applications such as agriculture, infrastructure, land mapping, marine surveillance, forest mapping, permafrost, geohazards and natural disasters.Footnote 35,Footnote 36 The interview data indicated that established operational users (i.e., AAFC, DFO, DND, ECCC and NRCan) are expanding their current applications, and that all user departments have been using SAR imagery for more diversified applications. The case studies demonstrated that the recipients of SOAR, GRIP and EOADP funding and/or imagery increased the use of SAR imagery due to the research aimed at developing applications for the federal government and exploring the enhanced capabilities of RADARSAT-2 and their potential contributions to various applications.
The interview data indicated that established operational user departments have a good understanding of their capacities and SAR imagery consumption, and that imagery acquisitions should stabilize for certain applications, such as Environment and Climate Change Canada (ECCC)'s SAR Winds. However, because these departments are also expanding some of their current applications, such as the addition of Areas of Interest (AOIs) and are building on their capacity for the development of new applications, they will increase their SAR imagery consumption in the future. Emerging user departments (i.e., PCA, INAC, PSEP, TC, etc.), still in the research or demonstration phases of their SAR applications, see many potential uses that could benefit their department. However, their internal capacity to use SAR imagery is lower compared to established operational user departments, making them uncertain of their future consumption.
Evaluation question (Relevance) 4: Has the EOBL accurately identified the needs of its current federal government user departments and agencies for SAR data and imagery?
Finding #4: The EO missions, RADARSAT-2 and RCM, accurately identified the user requirements for SAR data and imagery by established operational user departments, while departments who are less familiar with space imagery and its integration into operations have faced challenges in defining the full extent of their requirements.
The interview data revealed that the CSA worked with federal government departments and agencies in varying capacities to get a clear understanding of their needs for SAR data and imagery to be fulfilled by RADARSAT-2 and RCM. The CSA has moved from identifying needs at the beginning of a mission to engaging departments on a more regular basis through, for instance, user and science team meetings, GRIP project meetings, and RCM user meetings.Footnote 37 Documents showed how the CSA has engaged with departments, including
- consultations with stakeholders at the early developmental stages and on an ongoing basis to keep track of their current and longer-term needs;Footnote 38
- developing a long-term SAR continuity plan with government users "based on government needs in terms of services and enhanced capabilities";Footnote 24 and
- improving coordination of acquisitions through long-term planning with departments and agencies.Footnote 39
The document review found that continuity of service poses an inherent challenge to the CSA. While the CSA addresses a variety of rapidly evolving government department and agency users' needs, it takes several years—even a decade—to plan, design, build and operationalize space assets.Footnote 40
According to the RCM Project Implementation Plan, the RCM User and Science Team (U&ST) "was established by the user departments in collaboration with CSA and was created during the RCM Phase 0 with the mandate to advise CSA on the creation of the RCM program and its strategic objectives. The U&ST was initially responsible for defining and updating the RCM user requirements, which are contained in the User Requirements Document. Throughout the duration of the project the U&ST will provide support to all major reviews and the RCM Senior Project Advisory Committee in regards to issues concerning the capacity and development of user requirements, data utilization, and science related issues."Footnote 41 The U&ST Terms of Reference specifies that all federal government departments have a right to membership in the U&ST. In , the CSA invited interested government departments to designate members of the RCM U&ST. In total, eight departments were identified as members of the U&ST in the RCM Project Implementation Plan (ECCC, DND, DFO, AAFC, NRCan, PSEP, PC, TC). Although all departments were invited to express their needs and requirements for the RCM mission, interview data revealed that some emerging user departments have not seized this opportunity due to their challenge in defining the full extent of their requirements, as some departments are less familiar with space imagery and the range of possibilities its offers for integration into their operations. Other emerging user departments have relied on the expertise of larger user departments in defining user requirements.
The interview data highlighted as well that the lack of updated strategic direction for EO in the last five years has focussed the CSA's engagement with departments on the operational level. This has left departmental geomatic teams to make a case for their applications and budgets for space-based operations within their respective departments, mostly composed of established operational users which have stronger internal capacity for SAR data and imagery use.
The departmental profiles and interview data with user departments and agencies indicated that the needs of emerging user departments are, in some cases, more specific regarding the resolution, time of year, and location of the imagery and these departments are limited by their capacities to process SAR imagery. For example, INAC would require high-resolution imagery of communities to gain insight into any potential environmental risks in the area. They need imagery of reserves, which requires very targeted coverage and specific resolution. Given the current number of applications in the North, tasking the satellite for their acquisitions has been challenging.
Evaluation question (Relevance) 5: Has the EOBL addressed the interests and needs of its other stakeholders for involvement in EO related space-utilization development?
Finding #5: The EOBL support for Canadian private sector involvement in EO-related space-mission development generated significant direct economic benefits. Canadian EO value-added space companies and universities were also involved in application development programs mostly to meet the needs of government departments and agencies. In line with global trends and the industry support provided by other governments, there is opportunity for the EOBL to further support the development and competitiveness of the value-added space industry.
The RADARSAT Program consists of three missions. RADARSAT-1 was launched in in partnership with NASA and the US National Oceanic and Atmosphere Administration (NOAA). RADARSAT-2, launched in , was implemented using a different business model.Footnote 42 As per the case study on the benefits and impacts of the RADARSAT missions, "the commercial aspect [of RADARSAT-2] was seen to be increasingly important, and comparisons were made to the Satcom industry that had become almost entirely commercial".Footnote 43 The RADARSAT-2 mission represents a collaboration between government and industry; while MDA owns and operates the satellite and ground segment, the CSA helped fund the construction and launch of the satellite and has been recovering this investment through the supply of RADARSAT-2 data to the GoC during the lifetime of the mission.Footnote 44
The relationship changed once again to a contractual one for RCM where the GoC procured the services of MDA and retained the ownership of the satellite and the data it produces. The case study on the benefits and impacts of the RADARSAT missions specifies that "the Earth observation business did not evolve the same way as the Satcom business, as had been envisioned in the late '90s when RADARSAT-2 was being planned. Usage tends to be concentrated mostly in governments rather than consumers. Furthermore there is a tendency in other countries towards more open data policies, allowing data to be obtained for little or no charge. Consequently, the RCM is being implemented as purely Government procurement and, while there may be a commercial component, it will not assume the significance of RADARSAT-2."Footnote 45
The impacts of the RADARSAT missions on the Canadian space industry were documented in previous evaluations and reports commissioned by the CSA. The evaluation of the RADARSAT-2 Major Crown Project concluded that it was successful in developing MDA's EO expertise, which resulted in the company signing contracts with other space programs.Footnote 46 The case study on the benefits and impacts of the RADARSAT missions concluded that "the RADARSAT Program raised the profile of Canadian industry as competent and innovative suppliers of space hardware. (…) The RADARSAT program has confirmed Canadian leadership in SAR, established RADARSAT brand name around the world, and established a Canadian presence in the global space EO market place."Footnote 47 This study found that MDA and some 14 other EO space sector companies benefitted financially from the RADARSAT-2 and RCM mission design, development and manufacturing contracts for an estimated total of $240 million and $708 million respectively. The direct benefits to MDA and three other space sector companies will amount to at least $160 million for RADARSAT-2 and RCM satellite operations. Imagery sales and value-added products and services (VAPS) from RADARSAT-2 in alone were also estimated at $245 million and $126 million.Footnote 48 Extrapolating these figures through to the end of provides a conservative estimate of at least $2,221 million in economic benefits to the space sector predominated by MDA which has the marketing and distribution rights for the sale of data from all RADARSAT missions.
Between and , the EOADP funded 21 different EO companies to support 59 SAR application development projects. Although the EOBL logic model narrative provided in its PM Strategy specifies that support for application development provided by the EOBL aims at contributing to the development of an internationally competitive Canadian EO data utilization industry, such outcome is not identified in the logic model itself. The development of applications by the EO community is rather for use by GoC organizations to deliver on their mandates. That being said, it is to be noted that the EOADP survey data indicates that the EO companies funded through the EOADP may not otherwise have had the time or financial resources to develop capacity in using SAR imagery. The survey data demonstrated that 51% (n=21/41) of EOADP projects would not have been carried out without the CSA's support, while 27% would have been smaller in scope. The EOADP case study showed that the program enabled the company to build capacity in the use of SAR imagery, undertake research and develop applications, and explore opportunities to build relationships with the federal government.
The interview data indicated that academia was more involved under the RADARSAT-1 mission, when the CSA was trying to establish the roles of academics, the private sector and the public sector in the use of the new technology. The evaluation of the Earth Observation Data and Imagery Utilization Program (EODIU) found that 50% of EODIU projects were carried out in partnership with academia, while 40% were carried out in collaboration with industry. Many government (n=6) and industry (n=15) representatives consulted by the evaluation felt that they would benefit from the university community's greater participation in knowledge sharing activities or joint projects.Footnote 49 A CSA study on university research involving SAR imagery based on survey responses concluded that professors received funding from at least ten different sources, but predominately from NSERC (38), other federal government departments (24), as well as CSA (14).Footnote 50 The document and interview data showed that as the RADARSAT mission focus had moved from scientific to operational the involvement of academia was less prominent, although its role remained important in assisting the development of operational applications and training future SAR experts.Footnote 51 More than 50 universities are involved at different levels in the Canadian space sectorFootnote 52; in response to the EODIU evaluation, which recommended the CSA to implement mechanisms to financially support the participation of academia in the development of applications, the SOAR program funded six projects involving four universities in the end of the period covered by this evaluation for a combined total of $938,275. It is to be recognized as well that over the years 352 research projects involving researchers around the world were supported by the SOAR program through imagery supply, the cost of which was deducted from the CSA RADARSAT-2 credit (the remaining 142 projects were directly supported by MDA, thus not affecting the CSA's RADARSAT-2 SAR data allocation).
The SOAR program has been highly beneficial to academic research in terms of alleviating some of the costs associated with the use of RADARSAT-2 SAR data. Without the support of SOAR, 34% (n=27) of national and international SOAR survey respondents stated that there would have been an impact on their research scope. SOAR survey respondents also stated that the program made a large (38%, n=30) or very large (30%, n=24) contribution to their research needs. The case study on the University of Waterloo, which received funding and imagery, demonstrated that the program enabled them to explore the potential of polarimetric parameters and largely contributed to the achievement of the research results.
Evidence from the document review highlighted that as the EO sector evolves, the CSA could further enhance its support in meeting industry needs, and more specifically of the value-added space sector. As mentioned above and documented through the interviews and document review, the initial purpose of RADARSAT-2 was to launch in a commercialized area of EO, such as telecommunications satellites. However, EO business did not evolve as expected, driving the CSA to move toward a government-owned satellite. Over the years, RADARSAT-2 consumption rates have shown that much of the EO data is consumed by the public sector, which is in line with the RCM being specifically intended to meet the needs of government departments and agencies to ensure SAR imagery availability and provide cost savings. The focus on government departments and agencies is thus limiting the CSA's engagement with the private sector regarding data and imagery needs. As stated in the case study on the benefits and impacts of the RADARSAT missions, "the RCM Data Policy is still being formulated but it is clear that, first and foremost, the Government will use RCM data in support of national interests and will have the highest priority to order new RCM data to support its mandate and operations."Footnote 45
The document review found private sector needs increased between and . However, given the cost and limited opportunities to task the satellite, due to the increased use from government departments and agencies, there has been modest development of the EO value-added products and services segment.Footnote 53 The interview data suggested that the CSA played a limited role in the supply of SAR imagery to the private sector (other than through contracts and contributions to industry as part of the EOADP, for instance), but viewed the launch of the RCM as an increased opportunity to support the value-added space industry, given that the satellite will be government-owned.
In response to these challenges, industry looked at alternative suppliers through global markets where faster growth is expected and is moving towards the development of other sources, such as drones and micro satellites, to provide its geospatial data.Footnote 54 In addition and as stated above, there is a tendency in other countries towards providing open access to space data. The case studies showed that academics, government departments and agencies, and industry are using foreign satellites. The EOADP survey results indicated that 15 out of 16 respondents stating they used foreign satellite suppliers. Canadian researchers using SAR imagery do focus more on imagery from RADARSAT-2 given an allocation, but all use a variety of data sources including foreign satellites and non-SAR imagery. The government researcher survey also showed that 15 out of 25 respondents are using imagery from foreign satellites. If most stakeholders use foreign satellites to complement their data, in some cases they may as well do so to fill in gaps due to data acquisition conflicts.
4.2 Performance
This section presents the achievement of expected immediate, intermediate and ultimate outcomes, and the demonstration of efficiency and economy of the EOBL between and .
4.2.1 Achievement of expected outcomes
Evaluation question (Performance) 6: To what extent have EO RADARSAT missions achieved their immediate and intermediate outcomes?
Finding #6: EO missions have generated and delivered more SAR data and imagery to more government departments and agencies to support their mandates than ever before. All stakeholders were either satisfied or highly satisfied with the quality of the imagery, and the accuracy, coverage and interpretability of the SAR imagery provided.
In the EOBL logic model, the immediate outcome "EO missions provide GoC organizations and academia with data and information" contributes to the intermediate outcome "GoC organizations are using satellite generated space data and services to deliver on their mandates."
The performance data documented an overall increase in SAR imagery usage by government departments and agencies between and . The performance data from the GRDS End of Year reports from to showed that the CSA and MDA delivered 106,446 new acquisitions and 40,250 archived images (for a total of 146,696 images delivered by RADARSAT-2) to government departments and agencies between and . The overall number of new images delivered by RADARSAT-2 to government departments and agencies decreased between and , while the delivery of archived imagery increased (see Figure 2).
| Archived | 3,259 | 4,267 | 16,254 | 8,832 | 7,638 |
|---|---|---|---|---|---|
| New | 24,381 | 21,659 | 19,525 | 20,521 | 20,360 |
| Grand Total | 27,640 | 25,926 | 35,779 | 29,353 | 27,998 |
Note: Full Department of National Defense (DND) data are not included as they do their own SAR data processing to generate SAR imagery. These data were not included in the GRDS End of Year reports.
Source: GRDS End of Year reports – to –
New acquisitions received from RADARSAT-2 were very satisfactory in terms of the quality, accuracy, coverage and interpretability of the imagery. The interviews with user departments indicated that government departments and agencies have good access to data and imagery, and that for relevant users the CSA's ability to provide near-real-time imagery has been invaluable to the delivery of their mandates. User departments were highly satisfied with the timeliness of delivery; while it used to take 1.5 hours for imagery to become available, now departments receive it within 20 minutes via a file transfer protocol (FTP) website. Interview data suggested that some departments fear that the RCM will favour quantity over the quality of the imagery, which would not best suit the needs of certain applications. The departmental profiles indicated that emerging user departments are satisfied with the imagery provided and have found it useful for imagery in the Arctic, for instance. The case studies demonstrated that timeliness, quality, and access to imagery were satisfactory for the most part.
The CSA also supplies imagery to the private sector and academia through its funding programs. A total of 8,915 acquisitions have initially been requested by national and international researchers through the 494 SOAR projects; however, only 4,467 (50%) have been acquired. A portion of the 4,448 remaining images will likely be acquired by the 124 ongoing projects, but the rest of the projects are now closed and have not ordered as many images as anticipated. Of the 494 SOAR projects, 142 were directly supported by MDA, thus not affecting the CSA's RADARSAT-2 SAR data allocation. The SOAR e-survey indicated that SAR imagery is only a small component of all the data used by the researchers, only a few (n=11) respondents used SAR imagery as the major data input into their projects. For researchers who received support through the SOAR program, the e-survey demonstrated a high level of satisfaction with the timeliness (96%), interpretability (94%), and accuracy of the imagery (96%), as well as the availability of beam modes (86%), and the resolution (93%) and polarization (92%). The EOADP provides funding to the private sector to access SAR imagery and develop applications. Since the launch of RADARSAT-2, the EOADP projects have acquired approximately 8,670 new images and 4,800 archived images through the CSA order desk. The EOADP e-survey data demonstrated a high level of satisfaction with the SAR imagery, including access (92%), timeliness (100%), accuracy (92%) and coverage (92%), and the technical aspects of the satellite, such as the beam mode (85%), C-band resolution (100%), and polarization (92%).
Evaluation question (Performance) 7: To what extent has Ground Infrastructure achieved its immediate and intermediate outcomes?
Finding #7: The upward trend in archived imagery use demonstrated that the ground infrastructure has met the needs of user departments and industry, who are highly satisfied with the online catalogue of archived images. The evaluation found that the use of archived images by academia was also significant.
There are three immediate outcomes for Ground Infrastructure: "(1) the CSA's satellites are functioning as per operational requirements; (2) foreign satellite missions are supported; and (3) satellite data is provided to GoC organizations and academia." These contribute to the intermediate outcome "Expressed Canadian and foreign data needs are fulfilled by reliable national ground infrastructure."
The performance data illustrated that the use of archived imagery increased at a higher rate than new acquisitions. The increase in archived images can be attributed to the loss of RADARSAT-1 in and improved coordination of new acquisitions through EMOC. Evidence from the interview data with user departments demonstrated that access to archived images has greatly improved since the launch of the National Earth Observation Data Framework (NEODF). The interview data also indicated that a few users thought the nomenclature of the data on NEODF could be improved to give a better indication of the area of collection. NRCan is working to launch the Earth Observation Data Management System (EODMS), the follow-up system to NEODF, to accommodate the data input from the RCM; however, challenges remain with the IT infrastructure at the time this evaluation was conducted.
Archived images are often used as a baseline for government researchers monitoring any environmental change, and are also being used within current applications, such as before-and-after imagery for emergency management and disaster mitigation. Of all SAR imagery provided to academic researchers on SOAR projects since the beginning of the program, 41% were archived images and 59% were new acquisitions.Footnote 55 Researchers specify in their request the number of scenes they will need, and of this number, the distribution between new and archived images. In a few cases, the SOAR program team may impose the use of archived images due to efficiency and availability considerations.
Interviews with user departments and EOADP e-survey responses confirmed that access to and the timeliness of archived images were highly satisfactory. Of the 6 EOADP survey respondents who had access to RADARSAT-1 archived images (38%), 5 were satisfied or strongly satisfied with the availability and all were satisfied with the average length of time it took to receive the images. Satisfaction levels were similar for RADARSAT-2 archived images, which were used by 14 EOADP survey respondents (88%). Of these respondents, 10 were satisfied with the availability of images and all were satisfied with the average length of time it took to receive them.
Standard coverage, combined with improved valorization and accessibility to archived RADARSAT images would enable to further support the value-added space industry and academia stakeholders to have greater access to SAR imagery, and provide an effective way to reuse imagery for multiple purposes, such as research and the development of new applications. This is especially relevant in the case of RCM, where established user departments will have long-term acquisition plans for ongoing data collection. According to interview data within CSA, the EOBL will pursue its efforts to broaden access to RADARSAT archives by repatriating and reformatting data from closed RADARSAT-1 archiving centers and developing valorization strategies for RADARSAT-1 and -2 archives and products.
Finding #8: The implementation of the Enhanced Management of Orders and Conflicts (EMOC) procedures has improved user department data access and optimised the fixed federal government data allocation for RADARSAT-2. However, given the capacity limits of a tasked satellite serving a growing number of user departments and the government's credit allocation, data acquisition conflicts remain a challenge, notably for research purposes.
The agreement between CSA and MDA with regard to the RADARSAT-2 commercial model provided for a fixed federal government data allocation.Footnote 56,Footnote 53 The document review found that by , federal departments and agencies had used $225 million worth of the total $445 million of prepaid SAR data allocation.Footnote 57 This represents $62 million more than that used by and an average 7% annual increase, almost reaching the 10% optimal yearly target.Footnote 58 Targets related to the volume of SAR data delivered to federal organizations and other customers were exceeded in fiscal years –, – and –. The CSA and user departments were thus at risk that the SAR data credit allocation would be fully used before the launch of the RCM in , due to the following factors:
- service charges deducted from the credit, especially high between (launch of RADARSAT-2) and , accounted for more than 13% of the total credit;
- data submission conflicts with other government users; and
- the high cost of data prior although this was reduced after a price revision by MDA.
The CSA's - Report on Plans and Priorities identified a possible gap between partners' expectations and the data and services provided by the CSA due to possible interruptions, infrastructure challenges, personnel availability, project implementation or changes in partners' requirements and prioritiesFootnote 59. One of the strategies identified in response to such risk was the ongoing monitoring and implementation of mechanisms to optimize the allocation of RADARSAT-2 data portion of the government's credit. The implementation of EMOC succeeded in optimizing the allocation of the SAR data portion of the government's credit, as well as in reducing the service charges. The performance and interview data showed that departmental users are increasingly coordinating their acquisition requests, sharing imagery and value-added products for the delivery of multi-department operations, such as marine surveillance. Evidence in the performance data documented that the number of completed acquisition requests has increased over the course of the evaluation period, whereas failed or cancelled acquisition requests decreased between and , from 43% to 24%. The main reason for failed acquisitions was planning conflicts between government departments and agencies, MDA and other requests, orders for science or research and development (R&D) purposes being given lower priority for acquisition in the context of conflicts, as defined in the RADARSAT-2 data policy.
While EMOC has largely contributed in decreasing the number of acquisition conflicts, it remains a preoccupation given the increasing operational uses of SAR imagery by government departments and agencies. The performance data identified that acquisition conflicts affect data continuity for operational users—that is, the continuous access to SAR imagery as per their application requirements—, and are a challenge for application development and implementation for both established operational users and emerging user departments. Evidence from the interview data showed that most user departments have had issues with data acquisition conflicts that had an impact on their continuous access to SAR imagery as per the requirements of their applications, especially in some of the most popular locations such as the North. The case studies supported the finding that conflicts are one of the main issues in accessing the required data for user applications and their ability to task the satellite to meet their needs regarding the resolution and timeliness of the imagery.
Interview and survey data indicated that data acquisition conflicts remain as well a challenge for research purposes. Although RADARSAT images provided to SOAR recipients are at no cost for the researchers being deducted on the CSA's credit, the SOAR e-survey documented that data acquisition conflicts between commercial and government users were a limiting factor for producing research results, as respondents were often assigned a lower priority for requests with the order desk compared to commercial and government users. The SOAR e-survey highlighted the issue of conflicts as a barrier to imagery access, with 22% of respondents strongly dissatisfied with the process. The survey of government department and agency researchers showed that GRIP funded researchers will continue to use SAR imagery, but that there are risks to access for the private sector and researchers. Likewise, the EOADP e-survey indicated that conflict resolution remains a source of dissatisfaction with the imagery acquisition process for 38% (n=5) of respondents.
The previous evaluation of the Earth Observation Data and Imagery Utilization Program released in had documented the issue of RADARSAT-2 imagery acquisition conflicts, leading the evaluator to recommend the CSA "developing the RCM data policy in a manner that facilitates data access and sharing". As per the latest Management Response and Action Plan Follow-up Report published by the CSA's Audit and Evaluation Directorate in , "The RADARSAT Constellation Mission's Data Policy is in development. Work was done this year, in particular in collaboration with the departments involved, in the aim of ensuring that this policy meets RADARSAT Constellation Mission users' expectations with regard to access to and the sharing of data."Footnote 60
The order desk has been instrumental in providing satisfactory assistance to users. The performance, interview and case studies data showed that departments were highly satisfied with the order desk's assistance in supporting their requests and providing them with access to the images they need. Aside from the service provided by the order desk, the performance data illustrated that acquisition planning and the ordering process can be challenging for less experienced users. Established operational user departments such as ECCC and DND have an internal order desk to support teams in coordinating acquisition planning and ordering. The interview data indicated that new or infrequent users of SAR imagery have limited resources to support geomatic teams, and that the ordering process can be onerous because of the limited full-time equivalent (FTE) staff members dedicated to ordering, processing, and developing products within those departments. Of the SOAR survey respondents, 25% found the ordering procedures to be a barrier to SAR imagery use. An automated online system is being developed for the RCM to facilitate the data acquisition resolving process.
Evaluation question (Performance) 8: To what extent has EO Data and Imagery Utilization achieved its immediate and intermediate outcomes?
Finding #9: The three programs that targeted different EO community stakeholders have contributed to the increased development and use of space-based solutions by government departments in support of their mandates.
The immediate outcome "The EO community generates new ideas and has enhanced its ability to turn EO data into usable products and services" contributes to the intermediate outcome "GoC organizations are using space-based solutions to deliver on their mandate."
Over the course of the last five years, the EOBL has supported the development of new ideas through three different funding and imagery supply programs that support the EO community. This has expanded the use of SAR imagery in government departments and agencies. The GRIP supports government departments and agencies, the EOADP supports the private value-added space sector, and the SOAR program supports Canadian and international academic institutions and researchers. Each program is presented below.
Using a cost-sharing approach, the GRIP supported 60 projects with researchers at nine government departments and agencies; these projects may also involve other participating departments. In total, 55 out of these 60 projects (92%) were allocated to 4 established operational user departments (NRCan, ECCC, AAFC, and DFO). The remaining five departments were PC, PHAC, DND, and PWGSC (now PSPC). The projects have diversified the use of SAR imagery in the following domains: ice, oceans, agriculture, forestry, hydrology, mapping/land use, disaster management, interferometry, algorithm development and environmental monitoring. The departmental profiles showed that NRCan has been funded for the highest number of GRIP projects (18), and there are currently two GRIP projects that are in the pre-operational phases and one self-funded project. These support NRCan's current applications in geohazard mapping, monitoring and mitigation of natural disasters. The GRIP case study showed that the project examined is supporting DFO's Canadian Hydrological Service in developing nautical maps that will provide more accurate territorial delineation for marine security and marine navigation, as well as improve the protection of the marine environment. The Data Utilization and Application Plan (DUAP) for RCM supports 17 projects developed by four government departments and agencies to make optimum use of the RCM SAR imagery when the system becomes operational and to facilitate the development of users' capacity in various fields, such as marine surveillance, wetlands, sea ice and lake ice monitoring, and winds.
The evaluation of the Earth Observation Data and Imagery Utilization Program recommended the CSA to give "industry a greater role in the development of applications in response to the needs of federal departments and agencies".Footnote 6 Over the period covered by this current evaluation, the EOADP has supported 59 projects with 21 private companies across Canada through funding and imagery supply. The average project value was $387,163, compared to 60 projects from to for an average value of $288,000 per project. Those projects were mainly directed at application development in the environmental monitoring domain. The EOADP case study demonstrated that the applications developed by 3vGeomatics are being used by INAC to support Indigenous community planning in the Northern Territories by monitoring permafrost and providing maps of areas that may be affected by changing permafrost, with the aim of improving infrastructure planning. The departmental profiles demonstrated that Parks Canada benefitted from the funding provided to PCI Geomatics for the development of an application for processing lake ice imagery. 100% of EOADP survey respondents stated that the program improved their capacity to develop products, services, systems or methods in the satellite-based EO field. The survey also indicated the program has enabled the private sector to build partnerships with government departments and other firms, with a total of 25 funded projects involving collaboration with government departments and agencies (out of the 41 EOADP projects led by e-survey respondents).
The SOAR program funded six projects at four universities in Canada, and provided access to SAR imagery to more than 494 research projects globally. This has been a highly cost-effective way to promote the use of SAR imagery and the use of Canada's RADARSAT satellites across the world. The interview data documented that universities provided opportunities to train new students in processing SAR imagery and applications development, and that the University of New Brunswick now offers an 8-week course on processing SAR imagery. The SOAR case study showed that the project supported the Canadian Ice Service in monitoring changes in lake ice across 140 different sites through the development of algorithms. All three case studies showed that the EOADP, GRIP and SOAR programs have enabled training for students in SAR imagery use and improved application capacities.
The performance data indicated that there has been an increase in the production of research and scientific impact as a result of government researchers and academics using SAR imagery. The number of university professors using SAR imagery has increased at leading Canadian universities.Footnote 61 Conducted by the CSA, the SOAR survey results demonstrated that there were 304 post-graduate students involved in SAR at Canadian universities. The penetration rate of presentations referring to RADARSAT-2 SAR imagery at the International Geoscience and Remote Sensing Symposium (IGARSS) Symposium rose from 5% in to 8% in , demonstrating an increased use in the remote sensing field. There has been a steady rise in the production of peer-reviewed papers, and the CSA library counts 1,014 papers published relating to use of SAR data from RADARSAT missions since . The SOAR survey demonstrated that 236 academic papers had been produced using RADARSAT-2 SAR data since the program began, and 226 between and , with a broader variety of scientific domains researched by SOAR participants using RADARSAT-2 SAR data. The SOAR case study showed that the project published three peer-reviewed publications and gave three presentations at the European Geoscience Union. Another three peer-reviewed publications are anticipated, which will be presented at the American Geophysical Meeting. It also showed that three master's students were hired as a result of SOAR program funding. Government department and agency researchers are also publishing and disseminating their SAR data work supported by GRIP; telephone survey respondents stated that there are currently 12 publications released and 5 in the data analysis/collection phase intended for publication.
The multiple lines of evidence showed that foreign satellites are being used for multiple purposes. Interview data indicated that foreign data are an important component in the development of users' products. The interview data from user departments have noted limitations with regard to the SAR technology, compared with other sources of EO data, such as optical data and imagery. While SAR has been shown to be useful for certain applications like ice monitoring, optical data has been shown to be more beneficial for vegetation cover, for instance. For example, DND is using SAR data for a multitude of projects, including monitoring the DEW Line Clean-up project to detect any changes in and around landfills; however, the vegetation made it challenging to see changes in surface deformation compared to the data received during the winter months when the surface is covered in snow. The performance data demonstrated that the EOBL had ground station contacts with only two foreign satellites: Pléiades-1A and Pléiades-1B. The CSA mainly supported foreign missions through the launch support for TerraSAR-X, TanDEM-X, TET-1, GRACE 1 and 2, CALIPSO, Soyuz and Vega missions.Footnote 62
The evidence from the performance data, interviews with user departments, and departmental profiles highlighted the progress government departments and agencies have made in using SAR data and imagery to deliver on their mandates. Some departments had already established operational uses for SAR data prior to , while others have been able to evolve from research to operational phases in the development of SAR applications. Departments are using these applications to deliver on their mandates in a number of capacities, either as an input to larger activities or as the main source of activities. They are increasingly sharing products with each other in different ways to deliver on their mandates. The ways departments are using selected operational and emerging applications are discussed further below and demonstrated in Figure 3.
Figure 3 Flow chart
Figure 3: Flow chart - Text version
Operational applications:
- Environmental monitoring
- Marine Surveillance
- Agricultural information
- Disaster management
Emerging applications
- Land use mapping
- Infrastructure
- Geohazards
Operational Departments
- ECCC
- DND
- AAFC
- NRCan
- Public Safety Canada
Emerging Departments
- Parks Canada
- DFO
- Transport Canada
- CNSC
- Statistics Canada
- INAC
Operational Programs
- SAR Winds
- CIS
- ISTOP
- Opeation Drifnet
- Marine surveillance operations centers
- Crop inventory
- Soil moisture
- Emergency Geomatic Service
Environmental monitoring is a fully operational application and remains an important research area.
- The Canadian Ice Service at ECCC continues its operational application of sea ice monitoring and lake ice monitoring, providing information for safe ship passage and input on ECCC weather models, and increasing the understanding of ice changes in the Arctic. It also supports training to DND in the Arctic to guide them on safe routes.
- ECCC's SAR Winds operational application supports ECCC's marine forecasters with surface wind estimates over Canadian marine Areas of Interest (AOIs), including oceans and inland lakes. RADARSAT-2 is the primary data source for the National SAR Winds application.
- ECCC is also leading the Integrated Satellite Tracking of Pollution (ISTOP) program used to monitor Canadian waters for oil pollution. The imagery is validated by Transport Canada (TC), which sends an aircraft for site inspection. TC also uses the imagery to (1) report vessels to their destination country if they are outside of Canadian waters and may be leaking, and (2) provide vessel inspection recommendations to the US Coast Guard. More recently, the ISTOP program assisted in monitoring one of the discovered Franklin expedition ships.
- Parks Canada uses SAR imagery for monitoring lake ice in their Arctic parks as a measure of the parks' ecological integrity. The imagery contributes to one of several reporting indicators used to fulfill Parks Canada's mandate on the conservation of natural and cultural resources.
Marine surveillance is an operational application and one of the main uses for SAR imagery.
- DND and DFO work together on Operation Driftnet, a multinational maritime operation that monitors illegal, unregulated and unreported fishing activity in the north-western Pacific Ocean and thereby protects Canada's domestic fish stocks. DND was provided with SAR data, which has contributed to the Maritime Security Operations Centre (MSOC) and enhanced the effectiveness of the operational planning for and conduct of Operation Driftnet. The use of SAR imagery has refined the AOIs and has enabled DND to detect smaller vessels. The Aldergrove ground station uses SAR detections to validate signals from Automated Identification System (AIS) provided by ships in Canadian waters. The combination of both sets of images enables the Regional Joint Operations Centre to validate the location of the ships with TC, for ship detection and improving AIS validation. The use of SAR imagery for ship detection has reached maturity at DND, and the Regional Joint Operations Centres on both coasts use SAR imagery to provide frequent reports on ship activity.
- DND has also used SAR imagery to track illegal drug trafficking in the Caribbean Sea and eastern Pacific Ocean. Operation CARIBBE has been able to produce a more refined approach using multiple beam modes.
Agricultural information has become a fully operational application.
- Agriculture and Agri-food Canada (AAFC) has operationalized the crop inventory annual mapping using SAR imagery. This supports the generation of environmental indicators and improves a business risk program that supports Canadian canola farmers to access the European bio-fuel feedstock markets. The crop inventory uses SAR and optical imagery to provide an annual space-based crop inventory map, which supports the federal government's Open Data and Open Science initiative.
- AAFC has developed applications to monitor soil moisture using SAR imagery, which is now available to the public through the Soil Moisture Toolkit. This supports the agricultural sector to get a better sense of soil moisture for timing seeding.
- AAFC is using imagery to monitor agricultural activities in Canada and globally as part of the GEOGLAM project, which acquires imagery through SOAR JECAM over 10 sites. The project aims to reduce speculation on food prices.
Emergency management is operational for NRCan and Public Safety and Emergency Preparedness Canada (PSEP), while disaster mitigation is an emerging application.
- NRCan established the Emergency Geomatic Service, an operational application using SAR imagery to provide products such as maps and other information for emergency response. It is also developing a mobile application for citizen reporting in areas prone to disasters to validate findings from the SAR imagery.
- PSEP is promoting the use of SAR imagery to Canadian Provincial and Territorial Operations Centres for emergency management through the Federal Operations Centre Standards of Procedures for emergency management. PSEP also works with the provinces and territories to develop acquisition plans to request imagery of vulnerable areas to track ice jams in Ontario and spring flooding in Manitoba. NRCan is an important contributor to these activities.
- INAC is using SAR imagery to monitor spring flooding in Manitoban and Ontarian Indigenous communities to mitigate potential impacts and improve planning for emergency management in affected communities. There are currently 20 reserves selected for the acquisition of SAR imagery. These images will be used by the department to provide a before-and-after analysis of the sites affected.
- The CSA has supported international emergency response efforts. The document review found that Canada participates in the International Charter, Space and Major Disasters, which coordinates the space capabilities of its 15 member countries to provide timely and more effective access to Earth observation satellite data to countries affected by natural and manmade disasters. As of , Canada had used the Charter 11 times to monitor extreme weather conditions resulting in droughts or floods, forest fires, and manmade disasters like the oil spill resulting from the Lac Mégantic train explosion. In addition to RADARSAT-2 SAR data, images of the site at the time of the explosion were obtained from the French Pléiades satellite, which helped the teams in the field in their site rehabilitation activities.Footnote 63
The monitoring of geohazards is an emerging operational application.
- INAC has been using SAR imagery to monitor changes in permafrost to support northern communities in decision-making for municipal planning. The images are used to develop maps and reports for Northern municipalities in the Yukon and Northwest Territories that provide information on land surface movement and enable decision-makers to identify locations for infrastructure planning. These maps and reports have also been useful for northern airport authorities, who have used them to plan runways and their operation and maintenance.
Land use classification and mapping is an emerging application.
- ECCC is developing a tool for wetland classification using SAR imagery as an input, under the department's mandate for assessing, mapping, and monitoring ecosystem change, critical habitat, and ecosystem services. The products support the management of protected areas.
- ECCC has also been using SAR imagery to map and classify shorelines to identify those at risk of environmental emergencies, as well as to improve the Shoreline Cleanup and Assessment Technique through the Emergency Spatial Pre-SCAT for Arctic Coastal Ecosystems (e-SPACE) project. This project will be moving forward using the RCM for shoreline characterization.
- Parks Canada also uses SAR imagery as a complementary source of EO data for land cover mapping of its northern parks to gain a better understanding of the landscape. The images are also used in models for species range and resource-use mapping.
- DFO is aiming to use SAR imagery to improve its nautical charting of the Arctic for the Canadian Hydrological Service. The case study showed that the images will provide improved mapping of the Canadian coastline as well as fill in blank areas. The images will be used by mariners, but also support program activities such as territorial delineation, marine security and navigation, and marine protection to reduce the cost of data collection by the Canadian Coast Guard.
- Statistics Canada (StatCan) uses SAR imagery for land cover mapping and flood mapping using maps produced by AAFC, in order to target its surveys to specific populations not affected by floods to increase response rate and reduce burden on respondents.
Infrastructure monitoring is also an emerging application.
- TC researched the use of SAR imagery with the Yukon to monitor roads and transportation infrastructure for adaptation to climate change. In collaboration with the National Research Council, it also used SAR imagery to monitor bridge movement at the new Seaway International Bridge in Cornwall to detect movement and measure stability.
- The Canadian Nuclear Safety Commission is using SAR imagery to monitor nuclear facilities as part of the Canadian Safeguards Support Program and to report to the International Atomic Energy Agency. This project is still in the demonstration phase, looking at the fuel cycle movement of nuclear material from the mine to disposal to meet the obligations of an international protocol agreement under which signatory countries are required to report on all nuclear materials used.
Finding #10: The internal capacity of emerging user departments to process SAR imagery and operationalize space-based solutions is of varying degrees. Alternatively, some of the emerging user departments sub-contracted the services from the private sector or relied on established user departments to process SAR imagery.
The interview data documented that departments see the potential for SAR imagery use and continue to work on innovative uses for EO data applications, but some have limited internal capacity for processing SAR imagery and operationalize space-based solutions. The department profiles demonstrated that the capacities of emerging user departments are varied and use SAR imagery with varying degrees of processing. Some order the imagery and have the internal capacity to process it, while others work with larger departments or have private companies process the imagery and provide them with a product. ECCC, DND, AAFC and NRCan have been able to use their own software to process SAR imagery for their applications, while Parks Canada, Public Services and Procurement Canada, PSEP and INAC contracted companies to process their imagery. For departments internally processing SAR imagery, the lack of available resources to tend to technical issues pertaining to software and IT infrastructure can be challenging with the amount of incoming SAR imagery.
Finding #11: RADARSAT data and imagery sharing was identified as a barrier to the development and use of SAR applications by the EOBL stakeholders, while the cost of data and imagery acquisitions would have been a barrier in the absence of the EOADP, SOAR and GRIP programs.
Previous evaluation reports such as the Earth Observation Data and Imagery Utilization Program Evaluation () and the RADARSAT-2 Mid-Term Operations Review () highlighted the challenge pertaining to RADARSAT data sharing for imagery utilization and application development.Footnote 64 As previously mentioned, the RADARSAT-2 business model was selected with the aim at increasing EO business opportunities. The data sharing policy for RADARSAT-2, established within this commercially-geared context, has "discouraged and limited the potential benefits of partnerships (...) through cumbersome processes for sharing with academic or other partners."Footnote 65 The interviews conducted as part of this current evaluation showed that departments need to share imagery with key partners and reciprocate by sharing imagery with their partners and allies. In the SOAR e-survey, 35% of respondents named it as one of the factors that would have prevented them from using SAR imagery in their research, in the absence of the SOAR program. They also found it unfortunate that the images must be returned after the project is completed, as many would continue to use the images for further research applications. The inability to share data acquisitions between researchers was a barrier to research projects and developing new research applications. The Multiple Users Request Forms (MURFs) and the Value-Added Products could facilitate greater sharing; however, the interview data suggested that a more flexible data access policy would simplify the process. As mentioned under finding #8, the Earth Observation Data and Imagery Utilization Program Evaluation () had recommended the CSA to develop the RCM data policy in a manner that facilitates data sharing.Footnote 6 The data policy is still under development but the latest Management Response and Action Plan Follow-up Report published by the CSA's Audit and Evaluation Directorate in mentioned that collaborative work was conducted in - in the aim of ensuring that the data policy meets users' expectations with regard to data and imagery sharing.Footnote 60
The cost of data remains a challenge for using RADARSAT imagery. The interview data indicated that emerging user departments would not use SAR imagery if they did not have access to through the RADARSAT-2 credit allocation. Of the SOAR survey respondents, 89% stated that the price of RADARSAT data would be one of the barriers to conducting research in the absence of the SOAR program, while 88% of EOADP respondents stated the price of EO data compared with that of other sources of information was an obstacle to commercializing products and services. Among government department and agency researchers, 89% stated that their project needed continued support through departmental or CSA funding. Survey respondents noted that the support from the CSA through SOAR, EOADP and GRIP had a financial impact on their research and application development projects, as otherwise they would have had to buy the data and images.
Evaluation question (Performance) 9: To what extent has the EOBL achieved its ultimate outcome?
Finding #12: A more diverse number of SAR applications were operationalized during the – evaluation time frame, which contributed to more effective programs and services delivered by the departments and agencies involved and some cost savings.
The three intermediate outcomes discussed above contribute to the ultimate outcome "The GoC offers more diversified or cost-effective programs and services due to its utilization of space-based solutions."
As described above, the evaluation found numerous examples of federal government departments and agencies delivering more diversified services as a result of using SAR imagery. Based on information provided by the OGDs as part of the EOBL PM and this evaluation, the operational applications of SAR imagery have also provided to some extent more cost-effective programs. Some of the key areas in which this has occurred are discussed below.
Monitoring the Arctic has provided a reduction in operating costs for ECCC and INAC.
- ECCC's Canadian Ice Service (CIS) monitoring of sea ice and lake ice reduced the cost of operating the Canadian Coast Guard's icebreakers in ice-infested water by providing safe and efficient route planning for their normal seasonal operations. This resulted in $2.7 million in fuel savings for the Canadian Coast Guard's icebreakers and helicopters between and . While they have a lower resolution than aircraft-based SAR images, satellite imagery enable the CIS to cover a geographic area 15 times larger, more rapidly and at a cheaper price than previously, resulting in net savings of $138.6 million between and due to reduced flight hours of the Challenger aircraft.Footnote 63 The interview data supported this finding, as monitoring the Arctic is costly for many departments.
- ECCC's ISTOP program enables detecting and reporting on maritime oil spills more rapidly and under all weather or light conditions. The detection of possible oil spill events is trending downwards, signalling that the program is serving as an effective deterrent to polluters.Footnote 63
- INAC support to northern communities provides a cost-effective way to measure the potential surface displacements that can affect infrastructure development and maintenance. The EOADP case study demonstrated that the applications developed by 3vGeomatics are being used by INAC to support Indigenous community planning in the Northern Territories. This is achieved by monitoring permafrost and providing maps of areas that may be affected by changing permafrost, to improve infrastructure planning and investments.
Improved mapping for NRCan, DFO, ECCC, StatCan and AAFC to cover more ground more frequently.
- NRCan was able to cover the northern regions of the country for the first time on their 1:50,000 topological map of Canada, thanks to the use of RADARSAT-2 SAR imagery. The document review estimated that the use of SAR imagery from RADARSAT missions resulted in $27 million in savings on mapping and cartography between and .Footnote 66
- AAFC uses RADARSAT-2 SAR imagery, along with optical data, to produce annual digital crop maps and build its national crop inventory. This is shared with provinces, academia and other land users.Footnote 26 The document review found that these maps inform programs aimed at understanding and addressing climate variations and identifying trends in agriculture production, and are "essential in order to prevent both short-term and long-term threats to stable and reliable access to food."Footnote 26 As of , AAFC's crop inventory was the 15th most downloaded government data set.
- StatCan staff stated in an interview that since , StatCan has been solely using SAR imagery for its land-use survey and that AAFC's crop inventory is a component of this program.
- DFO's mapping of the Canadian coastline using SAR imagery will reduce the cost of data collection by the Coast Guard by $80,000 per day.
- ECCC's shoreline characterization will reduce the cost of the current method used, which involves geotagged videography with audio commentaries captured from low-altitude helicopter and is very expensive.
Reduction in flybys for marine surveillance and emergency management.
- DND developed its own ground stations to routinely use SAR data and imagery for more effective maritime surveillance, Arctic surveillance, environmental sensing and ship detection. For instance, the use of SAR imagery for maritime surveillance purposes enabled targeting of specific areas of concern instead of having a wide coverage of the oceans. This resulted in a 60% reduction in required CP140 flights. The performance data showed that the use of SAR imagery for the High Seas Driftnet operation achieved a 47% cost saving for the Joint Task Force Pacific. The use of SAR data from RADARSAT-2 has enabled DND to refine its AOIs and detect smaller vessels by using higher resolution imagery in those areas.
- PSEP and NRCan's use of SAR imagery has been also useful to limit perilous flybys during emergency management, as well as providing up-to-date flooding information to affected communities.
Evaluation question (Performance) 10: To what extent has the EOBL created opportunities for private sector organizations to develop and commercialize new EO products and services?
Finding #13: Global EO market opportunities for the Canadian private sector have grown significantly. Despite challenges to commercialization, the EOBL contributed to creating business opportunities for the value-added space industry.
The EO sector is growing and providing a number of opportunities for the private sector. The document review found, as mentioned previously, that industrial benefits related to the design, construction and manufacturing of all three RADARSAT missions have "played a significant role in the development of a viable and robust space industry in Canada" for key companies in the space sector.Footnote 63 Between (launch of RADARSAT-1) and , the space sector industry generated $3.34 billion in benefits from the RADARSAT-1 and -2 missions, of which $1.2 billion was accounted to the value-added products and services sector. RADARSAT missions have generated a number of savings to the oil and gas industry, commercial shipping and offshore fishing industry. As per the RADARSAT mission case study, "the combination of quantifiable industrial benefits and end user sectoral benefits of the RADARSAT Program to date (RADARSAT-1 and -2) are estimated to be between $4.8 billion and $5.1 billion."Footnote 63 The Survey of the EO Services Industry, which provides insights into the shape and health of the European and Canadian EO services companies, noted a significant overall increase in the percentage of industry sales to private sector organizations between and , which was deemed an "encouraging response as it provides evidence of good commercial take-up of EO services."Footnote 67
As the technology matures, there is a real opportunity for the EOBL to support the Canadian value-added service provider (VASP) industry sub-sector, which are reported to have generated $57 million in revenue from EO SAR data and services in .Footnote 68 Between and , VASP use of optical data has increased by 250%, whereas their use of SAR data has grown by 10% over the same period, after dropping in . Similar downward trends in SAR data use were observed in Europe, with European companies using 80% optical data and 20% SAR data in . The modest growth in VASP SAR data use correlates with a slowdown in RADARSAT-1 and -2 SAR data sales between and , from 19% in to 6% in . The VASP revenues from SAR data and services come primarily from international sources, in particular foreign industry clients, and "most VASP companies are SMEs [small to medium enterprises] and are currently transitioning to work in global markets," which will be "key, given the expectations of faster growth of global markets."Footnote 68
The EOADP e-survey respondents stated they have created products for a variety of applications using SAR imagery, including water and ice detection, land and forestry mapping, security and training. These are at varying levels of maturity, with eight operational and eight pre-operational. Of the 41 EOADP surveyed projects, 21 have been commercialized, and a remaining 15 are intended to be commercialized. Some of the supported companies have been able to develop between one and more than four commercialized applications with the funding—the majority focusing on water and ice monitoring, land detection, forestry mapping, security, training and "other." According to the EOADP e-survey, funded projects have generated an estimated $10 million in commercialized products.
The EOADP e-survey showed numerous impacts of the program on its funding recipients, as detailed in Table 2 .
| The EOADP has helped my organization to… | Strongly agree/Agree |
|---|---|
| improve its capacity (knowledge, expertise, skills, etc.) to develop products, services, systems or methods in the satellite-based Earth Observation field. | 100% (16) |
| stimulate the development of innovative applications using SAR data. | 94% (15) |
| satisfy the needs of our customers for applications that use SAR data. | 88% (14) |
| be more competitive in the satellite-based Earth Observation market. | 88% (14) |
| commercialize products, services, systems or methods using SAR data. | 75% (12) |
| enter new government or private markets. | 63% (10) |
The opportunities for the EOBL lay in the fact that RADARSAT-1 and -2 remain the primary providers of SAR data for Canadian VASPs, with a stable market share of 39%. The emerging competitors from Europe are rapidly catching up; for instance, COSMO-Skymed and TerraSAR-X had fast growth in sales in and of 78% and 39% and 5% and 59% respectively.Footnote 69 The document review found that the Canadian industry has a number of attributes that would support the development of the private sector, including a SAR-oriented space agency, a large international market, and a strong expertise and a skilled workforce in radar technology and applications that is recognized worldwide.
The document review found that several other space-faring nations and conglomerates have made important investments and developed strong policies, procurement mechanisms and programs to support the development of an internationally competitive national space industry over the last decade. These policies and programs aim to ensure that businesses are actively involved in the design and manufacturing of satellite systems and ground infrastructure, and the provision of value-added services. Some of the mechanisms used in other countries include government procurement policies that favour the domestic over foreign industries (e.g., the Buy America Act, ESA's fair return policy), aggressive industry-driven technology development programs (e.g., the UK Space Agency), procurement rules that allow for a competitive bidding process but also take into account industrial objectives (e.g., ESA industrial policy), and government as "first buyer/first user" of new technologies to boost export business.Footnote 30,Footnote 70,Footnote 26
The document review and interview data highlighted challenges to the commercialization of SAR applications by the Canadian VASP industry, such as the cost of RADARSAT-2 data and imagery, the limited implementation of open data initiatives, the complexity of SAR data and imagery use and analysis, conflicts with other users over data acquisition, and limited government support for the development of the VASP industry.Footnote 68 The EOADP case study indicated that there is a limited market size in the Arctic due to the small population that requests or requires the information. End users also lack an understanding of the product, and there is a gap in the capacity for decision-makers to integrate the product into their tools. There is also limited access to government and international markets because the federal government has built capacity in areas such as the Arctic—at times even providing similar products to government departments thus competing with the private sector.
4.2.2 Demonstration of efficiency
Evaluation question (Performance) 12: Has the EOBL been managed in an efficient manner?
Finding #14: All four SSPs of the EOBL have been managed efficiently using appropriate internal control measures, tight financial management and data usage allocations, and streamlined and flexible funding programs.
The EOBL has demonstrated an efficient use of funds for the delivery of all four of the SSPs. The planned expenditures for the EOBL between and were $1,013,933,000 across all four SSPs. The actual expenditures were $763,014,692, with a variance of -$250,918,308, a 25% difference between the planned and actual expenditures. The actual expenditures have been consistent over the course of to , with the exception of the SSP 1.1.1.1 EO missions being more variable as a result of the delays in building the RCM. Figure 4 illustrates the variance between the planned and actual budgets from to .
| - | - | - | - | - | |
|---|---|---|---|---|---|
| Planned | 118,457,000 | 145,008,000 | 271,925,000 | 245,145,000 | 233,398,000 |
| Actual | 117,676,006 | 114,788,227 | 191,617,580 | 152,849,213 | 187,086,666 |
The majority of the budget went to SSP activity 1.1.1.1 for EO Missions, with a total of $674,532,286, or 88% of the total budget. SSP activity 1.1.2.1 Satellite Operations (EO portion) received a total of $27,443,247 (4%), SSP activity 1.1.2.2 Data Handling (EO portion) received a total of $4,799,118 (1%), and SSP activity 1.1.3.1 EO Data Utilization received a total of $56,240,041 (7%). Capital costs represent a total of $640,403,242, or 84% of the EOBL actual expenditures, which are mainly the cost of the RCM in SSP 1.1.1.1 EO Missions, for a total of $635,423,413 (83%), and in SSP 1.1.2.1 Satellite Operations, totalling $4,917,830. The remainder of the budget, $122,611,449, was for operations and maintenance (O&M), salaries, and grants and contributions (G&Cs). The percentage distribution of the total budget for each SSP is presented in Figure 5.
Figure 5 Distribution of total actual expenditures by SSP from to
Figure 5 Distribution of total actual expenditures by SSP from to - Text version
Histogram, a graph depicted by bars, displaying the frequency distribution of total actual expenditures by SSP from to . There are 4 bars divided in 4 categories (Salaries, O&M, Capital, G&C).
| Earth Observation Missions: (Sub-Sub-Program 1.1.1.1) | Satellite Operations (EO portion): Sub-Sub-Program 1.1.2.1) | Data Handling (EO portion): (Sub-Sub-Program 1.1.2.2) | Earth Observation Data and Imagery Utilization: (Sub-Sub-Program 1.1.3.1) | |
|---|---|---|---|---|
| G&C | 968,514 | 0 | 0 | 2,854,028 |
| Capital | 635,423,413 | 4,917,830 | 0 | 61,999 |
| O&M | 10,765,017 | 12,402,506 | 4,338,047 | 46,505,671 |
| Salaries | 27,375,342 | 10,122,910 | 461,071 | 6,818,343 |
The funding programs for the development of data utilization have been delivered in an efficient and timely manner. The programs are funded through the Data Utilization SSP O&M and G&C budget, totalling $49,359,699 between and . Organizations received funds through a variety of means, such as internal memoranda of understanding (IMOUs), grants, contracts, and contributions. The SOAR program has been highly efficient. It has financially supported six projects, and has supported 494 projects (352 through the CSA's SAR data allocation), which has currently consumed 50% of its allocation budget. Using a cost-sharing approach with other federal departments and agencies, the GRIP supported 60 projects, with a budget of $16,641,717. The EOADP has been the largest investment, mainly through contracts and contributions, representing an investment of $23,721,681. It has supported 59 projects through funding and imagery access to 21 companies.
The CSA has been able to manage the EOBL by establishing measures to improve efficiencies. According to a CSA senior management representative, co-investments and cost sharing between the CSA and NRCan with respect to infrastructure and ground stations have resulted in efficiency gains, although more can be done to foster greater efficiency. The document review found evidence that cost-efficiency internal measures were taken to maximize the achievement of the outputs for users of SAR data and imagery. The governance structure was streamlined to ensure more effective decision-making and accountability for EO missions.Footnote 65 Also, the CSA has been proactive in stabilizing data consumption to reduce costs. Consultative mechanisms were put in place to address acquisition conflicts and better meet government users' needs, from which emerged an action plan to address data acquisition issues along with a working group to oversee its implementation. These have proved successful. The CSA also developed the GRDS as a consumption dashboard to monitor variations between planned and actual data utilization. The performance data showed that there was a significant decrease in late acquisition requests and fees from to . In , there were 186 late requests at a cost to government departments and agencies of $252,780, whereas in there were 51 late requests at a cost of $43,065. The CSA reduced conflicts due to improved department and agency acquisition planning, going from 134 failed requests due to conflicts in to 10 failed requests in . Conflicts with MDA's commercial activities remained variable during those periods.
Evaluation question (Performance) 16: Has the EOBL Performance Measurement Strategy facilitated the selection, development and use of performance measures for management decision making and evaluation?
Finding #15: The PM Strategy includes intermediate and ultimate outcomes indicators requiring input from other federal departments and agencies and the performance measurement approach is decentralized within the EOBL. This has made performance monitoring challenging and amplified the burden on user departments.
A review of the EOBL logic model revealed that, due to the nature of its activities, its intermediate and ultimate outcomes are not fully under the sphere of influence and manageable control of the EOBL as other federal government departments and agencies largely contribute to the achievement of these expected outcomes. This has made it challenging for the CSA to monitor the performance of the EOBL, as it requires continuous input from its users. The interview data indicates that this has been quite burdensome on users and they would like to see more streamlined reporting requirements from the CSA.
The CSA developed a PM Strategy to monitor the performance of the EOBL activities against a set of indicators measuring different aspects of the EOBL expected outcomes. The document review found that the CSA set performance targets and collected qualitative and quantitative data to inform its Departmental Performance Reporting between and . However, a review of performance data found that the performance targets and indicators often changed in the Performance Measurement Framework, and that the data collected by each SSP were not always reflected in the EOBL PM Strategy. Also, the PM Strategy does not fully outline how each SSP is accountable and how reporting should be done for the EOBL. The interview data documented that the performance measurement is undertaken by each different activity level but that there is no central reporting within the EOBL due to some operational issues regarding internal capacity to centralize the monitoring and reporting of performance data. This situation as made it challenging for the program officials to support the evaluation, as requested by the Treasury Board's Directive on Results.Footnote 71
4.2.3 Demonstration of economy
Evaluation question (Performance) 13: Has the EOBL been managed in an economical manner?
Finding #16: The EOBL has been economical in two distinct areas: in the shared FTE resources between CSA business lines and government departments and agencies, and in managing any RCM cost overruns for which MDA would be responsible.
The EOBL has been economical in its use of full-time equivalent (FTE) staff members across all SSPs. The financial data documented that the CSA shares its FTE resources across its business lines to limit duplication, while the IMOUs with federal departments enable it to support the capacity building of technical expertise within departments by using the internal capacity of each department to support SAR application development and research. Table 3 shows the average overhead rate for the program was 15% from to . The decrease in the planned expenditures of the RCM in EO Missions SSP 1.1.1.1 greatly affect the overhead rate, especially in – when the expenditures greatly increased and consequently increased FTEs and salaries. However, the number of FTEs increased over the following years to reach 15% in –. The interview data suggested that the CSA has been good at using FTEs for multiple projects, thus being efficient in its use of FTEs. The document review found annual salary expenditures are below the expected spending approved by the Executive Committee in .
| Overhead rate | - | - | - | - | - |
|---|---|---|---|---|---|
| Actual FTEs | 66.1 | 65.1 | 76.8 | 82 | 87.8 |
| Actual Salaries | $8,244,510 | $7,706,735 | $8,725,221 | $9,979,525 | $10,121,676 |
| Actual O&M | $18,529,632 | $13,705,719 | $9,342,707 | $12,910,286 | $19,522,897 |
| Total EOBL | $117,673,006 | $114,788,227 | $190,617,580 | $152,849,213 | $187,086,666 |
| Total Overhead Rate | 23% | 19% | 9% | 15% | 16% |
Source: CSA Finance Directorate, . Due to rounding, amounts may not sum exactly to totals.
At the SSP level, the financial data showed that each SSP was delivered using varying amounts of FTE resources and O&M. With the majority of the EOBL budget allocated to SSP 1.1.1.1 EO Missions, this SSP also had the largest salary expenditures and number of FTEs of all the SSPs, with an average of 48.5 FTEs on a yearly basis. This number has increased with the expenditures on capital costs. The SSP 1.1.2.1 Satellite Operations has used an average of 19.6 FTEs on a yearly basis. The majority of the expenditures are split between salaries and O&M, with only about $5 million in capital costs. The SSP 1.1.2.2 Data Handling had limited FTEs for its delivery, using an average of 0.5 FTE per year from to , for the $4,799,118 spent over the course of the evaluation. The yearly expenditures of the SSP have decreased from $1.8 million in – to $381,090 in -. SSP 1.1.3.1 EO Data and Imagery Utilization used an average of 7 FTEs on yearly basis for the delivery of its funding programs.
The document review found evidence that management response regarding the efficient use of resources was implemented following the RADARSAT-2 Mid-Term Operations Review on the consumption of SAR imagery. The interview data supported the evidence for EMOC having a positive reduction in the cost of processing fees.
The evaluation found that overall the RCM project was managed efficiently, with a proper management control framework in place according to the Internal Audit of the Management Framework of the Earth Observation Mission Program – RADARSAT Constellation Mission.Footnote 72 Furthermore, there is evidence that the CSA maintained a solid track record in monitoring the RCM project. Its components were reviewed multiple times in addition to the Audit.
Evaluation question (Performance) 14: Are there alternative delivery models that would be more efficient or economical?
Finding #17: The EO sector is rapidly changing with increased technology options, international cooperation, data sharing, and varying levels of commercial involvement all generating new delivery models, some of which have been adopted by the EOBL.
The document review identified alternative delivery models among other spaces agencies, along with trends in the EO sector in the provision of EO data and imagery. Until recently, US and European space policies had been prioritizing missions that generate benefits for users over scientific and technological advances.Footnote 73 The diversity of EO technology now available, from micro satellites to large infrastructure, and the variety of applications being developed require increased international cooperation to meet the emerging needs of departments to access data, imagery and products that would provide them with valuable information. The document review highlighted that increasing international cooperation in the space sector—and EO in particular—brings new opportunities to benefit from other space-faring nations' technologies and capabilities.
For the development of applications, the provision of open data is one key trend in the EO sector that has been shown to have many benefits to users. Interview data with user departments indicated that providing open data would improve data and imagery sharing among government departments and agencies and their partners. The documentation supported this finding as there is a global trend toward more open and free EO data sharing. In their 10-Year Implementation Plan, the 88 governments comprising the international Group on Earth Observations committed to promoting "full and open exchange of data" that should be made available "with minimum time delay and at minimum cost."Footnote 74 This is expected to contribute to a stronger space industry/commercial sector. For example, ESA's Copernicus program Sentinels missions are intended to be fully supportive of the growth in industrial revenues in the EO services sector through a large quantity of good quality data delivered by Sentinels being made freely, fully and openly available.Footnote 75
The interview data documented that the CSA has tried various delivery models to provide EO to government departments. While the RADARSAT-1 model served to explore the technology and its data and imagery was predominantly used to conduct research, the aim of the RADARSAT-2 model was to evaluate the commercial potential of EO data in Canada. As the technology matures, the RADARSAT-2 delivery model has shown its limitations and so the CSA has moved back to a government-owned satellite with the RCM to meet the needs of its established users and ensure data continuity. While the development of domestic infrastructure like the RCM was weighed against acquiring access to foreign data, the latter was not considered a realistic option because of the number of constraints around access to foreign data. In particular, since departmental users have moved to operational applications, the reliance on foreign data would not accommodate operational users that require near-real-time data.Footnote 76
Evaluation question (Performance) 15. Is the RCM on track to achieve key milestones, remain within budget and fulfill users' requirements as planned?
Finding #18: The RCM is on track to be operational by and fulfilling the requirements of federal government users within the budget allocated by the CSA.
The RCM is on track to meet its satellite launch date, despite a dwindling time contingency over the duration of the project. Phase D delays were an issue for the RCM project. The project has incurred several delays since the inception of the construction phase. Not all these delays have impacted the system-level schedule, and in cases where they did, the Prime Contractor was able to modify the plan to condense certain activities.Footnote 72 Failure to launch is one of the most significant risks outside of bus delivery to Assembly, Integration and Test. Nevertheless, these risks were both anticipated and well mitigated, according to interview data. One interviewee stated, "The whole program over the last 10 years was focussed around reducing technical risk for the precise phase we are in now."
As a continuation of the work undertaken by the U&ST, the CSA developed a working group focussed on completing a Data Utilization and Application Plan (DUAP). The DUAP provides a framework for the activities, management and resources, which will be supported by the RCM Major Crown Project to help with the operational readiness of the GoC users of the RCM in time for system commissioning scheduled in , and optimal use of the SAR data and imagery thereafter. The DUAP Working Group comprised representatives of federal departments and agencies (i.e., CSA, NRCan, ECCC, DND, AAFC, DFO and PSEP). The RCM DUAP "is aimed at supporting the development of Earth observation applications and user capabilities to facilitate integration and/or transition of those applications into their operations with a goal to start exploiting the benefits of RCM when the system becomes operational."Footnote 77
Memoranda of Understanding (MOUs) continue to be negotiated, developed and signed. Three of these relate specifically to NRCan regarding the work of the CCMEO. Two of the MOUs have been signed by the CSA and NRCan, with the third still being discussed as of the date on this report. No concern was raised during interviews about the eventual agreement and signing of the third MOU.
Launch/on orbit failure is one of the other key risks, as previously noted. Presently, there is no long-term contingency plan should the satellites fail to launch, according to interview data, although the CSA and ESA were collaborating on ways to support each other's satellite systems. In , an agreement was reached between ESA and the CSA "to facilitate access to the Sentinel satellite data primarily for users from Canada." The deployment of a mirror site and Collaborative Archiving and Dissemination Centre under the CCMEO were components of the agreement.Footnote 78 The CSA continues to work with ESA on having access to Sentinel 1a and 1b and is looking at commercially available L, C and X-band data that can be purchased from Italian, German and Japanese agencies. An interdepartmental working group presently exists to explore the possibilities in the event of launch failure.
Federal government departments and agencies made data continuity a high priority. Many are receiving CSA funding through DUAP to develop the ability to use the SAR data that will be produced by the RCM.Footnote 77 These departments and agencies utilize approximately 30,000 RADARSAT images in a given year. This figure has climbed sharply since – and illustrates the importance of SAR imagery across government departments and agencies. Many of these users rely exclusively on SAR data and images to fulfill their respective mandates. These departments and agencies would have to rely on foreign data should the RCM fail. This would result in higher costs, as well as limited and slower access to data and imagery.Footnote 79
The DUAP projects are progressing as planned with few exceptions. Two projects were completed, and all were on schedule; however, two projects have experienced problems in communication and project management, according to documents provided by the CSA. These projects represent 28.8% of the total DUAP funding and are being closely monitored as high risk.
There are several applications of the RCM data and imagery that overlap in terms of the user groups they will serve. Table 4 summarizes the common areas of interest across the various federal departments and agencies. Large geographic and temporal overlaps also exist among users' applications requirements, compounded by various preferred imaging modes. A need was identified to develop a coordinated strategy amongst user departments and agencies for RCM data acquisition known as Standard Coverage. The use of Standard Coverage will essentially require that federal departments and agencies work collaboratively.Footnote 77
| Interest | INAC | AAFC | DFO | DND | ECCC | NRCan | PC | PSEP | StatCan |
|---|---|---|---|---|---|---|---|---|---|
| Arctic Coastal ecosystems | Yes | - | - | - | Yes | - | Yes | - | - |
| Ecosystems | - | - | - | - | Yes | Yes | Yes | - | - |
| Flood mapping | Yes | Yes | - | - | Yes | Yes | Yes | Yes | Yes |
| Lake ice on/off | Yes | - | - | - | Yes | Yes | Yes | - | - |
| Permafrost | - | - | - | - | - | Yes | Yes | - | - |
| Sea ice | - | - | Yes | - | Yes | - | Yes | - | - |
| Ship detection | - | - | Yes | Yes | - | - | - | - | - |
| Water extent | - | Yes | - | - | Yes | Yes | Yes | - | Yes |
5. Conclusions and recommendations
5.1 Relevance
Conclusion #1: As set out in CSA's PAA, the EOBL logic model outcomes have been aligned primarily with federal government priorities to assist federal government departments to increasingly access SAR data, imagery and space-based solutions to deliver on their mandates. Consequently, the EOBL programs and activities have leaned more toward increasing the number of federal government programs using SAR imagery rather than increasing the use of SAR imagery among a larger number of departments and expanding their access to a variety of EO data. The EO community, which includes academia and the value-added space industry, is identified in the EOBL logic model as a means to support innovation and application development for use by the federal government. As the EO technology matures, there is opportunity for the EOBL to further support academia and the development of the value-added space industry.
The EO sector has evolved at a steady pace over the course of the evaluation period, with an increased number of satellites being launched by more countries and private stakeholders, as well as new technologies emerging onto the market. The EOBL has aligned with Canada's Space Policy Framework (), which informs Canadian space activities by prioritizing the use of space in support of Canadian interests. Regardless of the Space Policy Framework, the EOBL did not benefit from an updated long-term strategic direction for space development in the EO sector over the period covered by this evaluation. The federal government is currently working on a federal EO strategy that will provide a framework for federal investments in EO operational capabilities, along with the Innovation and Skills Plan and the upcoming Space Strategy.
Over the period covered by this evaluation, the EOBL has largely been responsive to the federal government priorities and those of the CSA by aligning the outcomes of the EOBL and the design of the RCM with the needs of federal government departments and agencies. The EOBL provides government departments and agencies with access to SAR data and imagery for the development of space-based solutions to help them deliver on their mandates that contribute directly or indirectly to the prioritized national issues. Although both RADARSAT-1 and RADARSAT-2 were built as operational missions, the use of data and imagery evolved from one mission to the next. While RADARSAT-1 data and imagery was predominantly used for research purposes, the more commercially-geared RADARSAT-2 mission led to an increased number of stakeholders requesting access to SAR data and imagery.
There has been a rapid growth in the development of operational applications by user departments and agencies within the government, but the CSA's engagement with departments on the operational level was largely focussed within a few departments which have stronger internal capacity for SAR data and imagery use.
The EOBL support for Canadian private sector involvement in EO-related space-mission development generated significant direct economic benefits. Canadian EO value-added space companies and academia were also involved in application development programs in part, as illustrated in the EOBL logic model outcomes, to support innovation and application development for use by the federal government. In line with global trends and the industry support provided by other governments, there is opportunity for the EOBL to further support academia and the development and competitiveness of the value-added space industry. Government departments and agencies, academia and the private sector are using multiple sources of EO data from foreign satellites to generate space-based solutions and there is a tendency in many countries towards open data initiatives. Reviewing the EOBL program outcomes in a manner that is inclusive of the needs and interests of all stakeholders for a variety of EO data would ensure that the EO sector evolves with current global trends.
The CSA's role in designing, launching and operating EO missions for the provision of SAR data, data handling, and promoting data and imagery utilization is very appropriate. As the EO sector evolves, international partnerships are becoming increasingly important; here the role of the CSA is very relevant and viewed as an important responsibility for improved access to EO data from foreign satellites.
Recommendation #1: Considering that the Treasury Board Policy on Results requires departments to develop their Departmental Results Framework and Program Inventory, the CSA should seize the opportunity to review its EO program outcomes in order to appropriately reflect the range of EO stakeholders in Canada and respond to their needs by providing access to a variety of EO data, including data from foreign satellites.
5.2 Achievement of outcomes
Conclusion #2: The EOBL has been effective in delivering quality and timely SAR data and imagery and supporting ground infrastructure for the provision of new and archived SAR imagery, and has generated new space-based solutions for government and industry. However, given the capacity limits of a tasked satellite serving a more diverse and increased number of SAR imagery user departments, data acquisition conflicts remain a challenge, particularly among the value-added space industry and academia stakeholders.
The EOBL has achieved its ultimate outcome by providing government departments and agencies with high-quality SAR data and imagery, and supporting them in the development of space-based solutions. EO missions have generated and delivered a continuously increasing quantity of SAR data and imagery between and to support government departments and agencies to deliver on their mandates. SAR data and imagery has been invaluable in achieving cost savings for departments operating in the Arctic, for instance.
The EO sector is developing quickly, and the demand for different types of EO data to complement SAR imagery may require different types of satellite infrastructure and/or access to different types of EO data that would benefit all EO stakeholders. A variety of options are currently being used or could be used by the EOBL to increase data supply, such as commercial data supply, other types of satellites like optical and infrared, trade-offs between cost of satellite components and quality of data that may benefit a larger number of users, micro satellites, and partnerships to access foreign satellites. The increase in RADARSAT imagery users has amplified the potential for conflicts over new acquisitions, which was partly resolved by the implementation of the Enhanced Management of Orders and Conflicts (EMOC) for user departments; data acquisition conflicts remain a challenge among the value-added space industry and academia stakeholders. The use of archived imagery has increased during the period covered by the evaluation and users are highly satisfied with the online catalogue of archived images. Standard coverage, combined with improved valorization and accessibility to archived RADARSAT images would enable to further support the value-added space industry and academia stakeholders to have greater access to SAR imagery, and provide an effective way to reuse imagery for multiple purposes, such as research and the development of new applications. This is especially relevant in the case of RCM, where established user departments will have long-term acquisition plans for ongoing data collection.
The EOBL funding programs have been effective in the development of applications to support government departments and agencies to deliver on their mandates. These user departments have varying resources and capacities to process SAR imagery in order to develop and support space-based solutions. The EOADP, GRIP and SOAR funding and imagery supply programs have been instrumental in building departmental users' capacity. However, there is still a need to give the value-added space industry a greater role in providing services for the development of applications in response to the needs of emerging user departments to further build their capacity. In addition, the EOADP, which engages the value-added space industry, has shown a great return on investment with the commercialization of half of the surveyed projects supported. A two-tiered funding model based on the technology readiness-level scale, which distinguishes between proof of concept and pre-commercialization stage projects, could further enhance the commercial benefits of this program.
Recommendation #2: The CSA should enhance the effectiveness of the applications program by reviewing its design and funding options to better support building EO data departmental user capacity and developing a competitive EO value-added space industry in Canada.
5.3 Efficiency and Economy
Conclusion #3: The EOBL has been managed in an economical and efficient manner using internal management controls and various business models to suit the Canadian context. The evaluation has identified opportunities for improvement with respect to performance measurement tools and systems, currently decentralised within the EOBL, with the aim of producing adequate performance measurement data to support the evaluation function and senior management decision-making.
The EOBL has been managed in an efficient manner for the delivery of its four SSPs. The main budget variation has been due to delays in the design of the RCM caused by accommodating the evolving needs of government user departments and agencies. The CSA has managed to keep the RCM on track to meet its deadline. The funding programs have been a highly efficient way to support data utilization by providing imagery to government department and agency, the private sector, and academia through a variety of funding and imagery supply mechanisms. These programs enabled the CSA to have a large reach in terms of the number of projects supported by the GRIP, EOADP and SOAR programs.
The EOBL has also been economical with the inputs required to deliver the program. The CSA uses the same FTEs across its business lines to limit duplication, while the internal memoranda of understanding (IMOUs) with departments leveraged the number of FTEs involved in the program, but also built capacity across government for SAR imagery use. Furthermore, the CSA has implemented internal cost-saving measures, including reducing annual salary expenditures and travel costs. Introducing EMOC has been one of the most significant measures for reducing the data and imagery costs incurred by government departments and agencies, along with saving allocations to ensure that they do not reach their limit until .
The EOBL developed a logic model to outline its outcomes, outputs and activities. Due to the nature of its activities, the EOBL intermediate and ultimate outcomes focus on federal government achievements, making it challenging to measure and report on results. The ongoing reporting from government departments and agencies has created user fatigue. The data collection has been undertaken by each SSP, who developed their own tools or reporting processes, which have not consistently fed into the EOBL PM Strategy and CSA Performance Measurement Framework. Improving coordination between SSPs for more streamlined and coordinated reporting requirements would ease the burden on government user departments and agencies. The importance of improving performance measurement systems to generate evidence-based information to manage and improve programs, policies and services and support evaluation function has received renewed attention by the GoC, through its Policy on Results ().
Recommendation #3: The EOBL performance measurement mechanisms and tools should be redesigned and operationalized in a more coordinated manner centralized within the EOBL, with the objective of generating accessible and useful performance data to support the evaluation function and senior EOBL management.
6. Management response and action plan
| Recommendation | Responsibility Organisation / Function |
Management response | Details of action plan | Schedule |
|---|---|---|---|---|
| # 1 Considering that the Treasury Board Policy on Results requires departments to develop their Departmental Results Framework and Program Inventory, the CSA should seize the opportunity to review its EO program outcomes in order to appropriately reflect the range of EO stakeholders in Canada and respond to their needs by providing access to a variety of EO data, including data from foreign satellites. | DG, Space Utilization, supported by DG, Programs and Integrated Planning | The EO Business Line will review its program outcomes and take under consideration the recommendation to reflect the range of stakeholders while aligning with the defined departmental core responsibilities. Responding to all needs, including those requiring EO data from foreign satellites, will be part of the considerations. |
Actively engage in the corporate-led activities on the implementation of the Policy on Results and diligently review the EOBL outcomes through the development of the Program's Performance Information Profile, in relation with the Departmental Results Framework and indicators and all other guiding documents applicable. | |
| # 2 The CSA should enhance the effectiveness of the applications program by reviewing its design and funding options to better support building EO data departmental user capacity and developing a competitive EO value-added space industry in Canada. | DG, Space Utilization | CSA will review the applications program design and funding options to align its objectives, programs activities and expected outcomes with the CSA's Departmental Results Framework and other guiding documents applicable. | Prepare a renewed applications program including the definition of objectives, business model and framework. | |
| # 3 The EOBL performance measurement mechanisms and tools should be redesigned and operationalized in a more coordinated manner centralized within the EOBL, with the objective of generating accessible and useful performance data to support the evaluation function and senior EOBL management. | DG, Space Utilization | Performance measurement tools will be redesigned while developing the Program's Performance Information Profile in compliance with the Policy on Results. | Develop the Program's Performance Information Profile. |
Appendices
Appendix A: EOBL Logic model

EOBL Logic model - Text version
Ultimate Outcome
- The GoC offers more diversified or cost-effective programs and services due to its utilization of space-based solutions (PMF 1.1)
Intermediate Outcomes
- 1.1.1.1 EO Missions: GoC organizations are using satellite generated space data and services to deliver on their mandate (PMF 1.1.1)
- 1.1.2 Ground Infrastructure 1.1.2.1 and 1.1.2.2: Expressed Canadian and foreign data needs are fulfilled by reliable national ground infrastructure (PMF 1.1.2)
- 1.1.3.1 EO Data Imagery Utilization : GoC organizations are using space-based solutions to deliver on their mandate (PMF 1.1.3)
Immediate Outcomes
- 1.1.1.1 EO Missions: EO missions provides GoC organizations and academia with data and information (PMF 1.1.1.1)
- 1.1.2 Ground Infrastructure 1.1.2.1 and 1.1.2.2:
- CSA's satellites are functioning as per operational requirements (PMF 1.1.2.1)
- Foreign satellites missions are supported (PMF 1.1.2.1)
- Satellite data is provided to GoC organizations and academia (PMF 1.1.2.2)
- 1.1.3.1 EO Data Imagery Utilization : The EO community generates new ideas and has enhanced its ability to turn EO data into useable products and services (PMF 1.1.3.1)
- 1.1.1.1 EO Missions, 1.1.2: Ground Infrastructure 1.1.2.1 and 1.1.2.2, 1.1.3.1 EO Data Imagery Utilization : Increased awareness of EO potential
Outputs
- 1.1.1.1 EO Missions, 1.1.2 Ground Infrastructure 1.1.2.1 and 1.1.2.2, 1.1.3.1 EO Data Imagery Utilization : EO strategic documents
- 1.1.1.1 EO Missions, 1.1.2 Ground Infrastructure 1.1.2.1 and 1.1.2.2, 1.1.3.1 EO Data Imagery Utilization: Publications, Presentations, Workshop, Reports
- 1.1.1.1 EO Missions, 1.1.3.1 EO Data Imagery Utilization : Agreement to gain access to EO data
- 1.1.1.1 EO Missions: Canadian instrument on foreign satellite
- 1.1.1.1 EO Missions: Canadian satellite
- 1.1.1.1 EO Missions, 1.1.2 Ground Infrastructure 1.1.2.1 and 1.1.2.2: Canadian ground infrastructure
- 1.1.2 Ground Infrastructure 1.1.2.1 and 1.1.2.2: Tasking of satellite and ground infrastructure systems and Management of data
- 1.1.2 Ground Infrastructure 1.1.2.1 and 1.1.2.2, 1.1.3.1 EO Data Imagery Utilization : Working groups and reports
- 1.1.3.1 EO Data Imagery Utilization: Contracts/Agreements
Activities
- 1.1.1.1 EO Missions, 1.1.2 Ground Infrastructure 1.1.2.1 and 1.1.2.2, 1.1.3.1 EO Data Imagery Utilization : Needs assessment of GoC organizations
- 1.1.1.1 EO Missions, 1.1.2 Ground Infrastructure 1.1.2.1 and 1.1.2.2, 1.1.3.1 EO Data Imagery Utilization : Communication and Outreach
- 1.1.1.1 EO Missions, 1.1.2 Ground Infrastructure 1.1.2.1 and 1.1.2.2, 1.1.3.1 EO Data Imagery Utilization : Space-based EO data requirements
- 1.1.1.1 EO Missions, 1.1.3.1 EO Data Imagery Utilization : Bilateral and multilateral negotiations to obtain (exchange) EO data
- 1.1.1.1 EO Missions:
- Mission concepts
- Feasibility studies (Phase 0)
- Development of Canadian instruments for foreign missions (Phases A-B-C-D)
- Development of Canadian EO missions (Phases A-B-C-D)
- 1.1.1.1 EO Missions, 1.1.2 Ground Infrastructure 1.1.2.1 and 1.1.2.2: Feasibility studies
- 1.1.1.1 EO Missions, 1.1.2 Ground Infrastructure 1.1.2.1 and 1.1.2.2, 1.1.3.1 EO Data Imagery Utilization : Satellites operations and Ground infrastructure requirements
- 1.1.1.1 EO Missions, 1.1.2 Ground Infrastructure 1.1.2.1 and 1.1.2.2: Feasibility studies
- Ground Infrastructure 1.1.2.1 and 1.1.2.2: Satellite operations
- Ground Infrastructure 1.1.2.1 and 1.1.2.2: Data handling
- 1.1.1.1 EO Missions, 1.1.2 Ground Infrastructure 1.1.2.1 and 1.1.2.2, 1.1.3.1 EO Data Imagery Utilization : Data utilization support requirements:
- Ground Infrastructure 1.1.2.1 and 1.1.2.2, 1.1.3.1 EO Data Imagery Utilization : Planning, coordinating and monitoring EO data usage and requests
- 1.1.3.1 EO Data Imagery Utilization : Planning, coordinating and monitoring of EO data utilization initiatives