
State of the Canadian Space Sector Report - Facts and Figures
On this page

For more information on the contents of this report, please complete the CSA's information request form: https://www.asc-csa.gc.ca/eng/forms/information-request.asp.
For more information on reproducing the materials in this report, please contact pitt-iptt@asc-csa.gc.ca.
© Her Majesty the Queen in Right of Canada, as represented by the Minister of Innovation, Science and Industry, .
ISSN: 2369-6338
About this Report
In this section
Objective
The State of the Canadian Space Sector Report provides factual information about the Canadian space sector. The report, which is now in its 23rd edition, is based on a questionnaire sent to companies, not-for-profit organizations, research centres and universities with space-related activities in Canada. This year's report is based on data from 208 organizations that responded to the survey.
New sections were added to the report this year on gender, return on investment (ROI), and analyses conducted in tandem with Statistics Canada through the Linkable File Environment (LFE), which contains data from . Further information on the LFE is available in Annex B.
To align with international practices, the publication is identified by the year in which the survey took place (), but reports on data covering the year . With the exception of the COVID‑19 and LFE sections of this report, all data refer to . The report includes data on the number of organizations active in the sector and their composition, the sectors of activity, the Canadian space workforce and its composition, research and development (R&D), and innovation. In this edition, data on economic trends are reported for the – period. Readers should consult previous editions (available on the Canadian Space Agency website or the Government of Canada Open Government portal) for information regarding results prior to .
The organization-specific information used to compile this report remains strictly confidential and will not be released in any manner other than aggregate form. Consequently, in certain circumstances, a detailed explanation or in-depth reporting of the results cannot be provided in order to protect the confidentiality of the respondents.
Of note, the numbers presented throughout the report may not add up precisely to the totals provided due to rounding.
About the Authors
Policy Branch
This report is produced by the Economic Analysis and Research Team, Policy Branch, at the Canadian Space Agency (CSA).
Contact
- David Haight, Chief Economist, david.haight@asc-csa.gc.ca
- Aaron Parsons, Analyst, aaron.parsons@asc-csa.gc.ca
Please send media inquiries to CSA Communications, 450-926-4370, asc.medias-media.csa@asc-csa.gc.ca.
For More Information
For more information about the Canadian space sector, or for an electronic copy of this report, please go to www.asc-csa.gc.ca/eng/publications.
Acknowledgments
The CSA wishes to acknowledge all those who responded to the questionnaire. Without them, this report would not have been possible.
President's Message

Lisa Campbell, President of the Canadian Space Agency (CSA). (Credit: CSA)
As the President of the Canadian Space Agency (CSA), I am pleased to present the State of the Canadian Space Sector Report: Facts and Figures . The report, which has been published since , is the primary reference on the Canadian space sector. It contributes to our understanding of the sector by providing comprehensive and authoritative data, as well as long-term trend analysis on the economic activity generated in the Canadian space sector.
The State of the Canadian Space Sector Report: Facts and Figures is based on information gathered from 208 organizations involved in space activities from across Canada, including small businesses, multinational space companies, not-for-profit organizations, research centres and universities.
COVID-19 significantly impacted the Canadian space sector in the second quarter of . Traditionally, the survey would only contain data, but given the circumstances, questions were added to assess the preliminary impacts of COVID-19 during the / fiscal year. Results indicated that COVID-19 had a significant negative impact on company revenues, demand for services, employment, and supply chain operations across the Canadian space sector.
In , the space sector produced revenues of $5.5B and contributed $2.5B to Canada's gross domestic product (GDP). Research and development (R&D) expenditures reached a total of $376M, while commercialization revenues from government-funded projects totalled $253M. A new section on return on investment (ROI) was added to the report this year, revealing that for CSA space development programs, for every dollar invested, 2.5 dollars are returned through follow-on revenues – a multiplier of 2.5 times. Space sector organizations reported a total of 243 inventions and 66 registered patents.
The Canadian space workforce grew to over 10,000 jobs, while activities in the space sector supported more than 12,000 additional jobs in the wider Canadian economy. New questions related to gender were added to the survey this year which capture the gender balance for the entire space workforce. It is estimated that 28% of people in the Canadian space sector identify as female, and 72% identify as male.
I trust you will find this publication useful. I would like to convey my gratitude to all those who contributed to the survey. This publication would not be possible without the generous collaboration of members of the Canadian space industry and academia.
1. Executive Summary
In , total revenues in the Canadian space sector declined slightly to $5.5B. The average annual growth rate of the space sector between and was 0.9%. The space sector is estimated to have contributed $2.5B to Canada's GDP in and supported a total of 22,879 full-time equivalent (FTE) jobs in the greater Canadian economy (including space sector jobs, supply industry jobs and jobs created as a result of consumer spending).
COVID-19 questions were added to the survey this year in order to assess the preliminary impacts on the / fiscal year. COVID-19 had a significant negative impact on company revenues, demand for services, employment, and supply chain operations across the Canadian space sector. Larger companies appear to have been affected more significantly than smaller companies. Employment is one area that had the least negative impacts, due in part to government support programs.
In , the upstream segment accounted for $931M in revenues, while the downstream segment accounted for the vast majority of revenues, at $4.6B. Of note, broadcasting services revenues were $2.0B in , representing a full 45% share of the downstream segment. While Satellite Communication as a whole remained the sector of activity that accounted for the majority of revenues (83%), Space Science was the sector that experienced the highest growth (68%) in . Domestic revenues decreased by 6.3% year-over-year and totalled $3.2B in , resulting in the slight overall decline in revenues. Export revenues, on the other hand, increased by 1.4%, totalling $2.3B.
The space sector workforce totalled 10,541 space-related FTEs in . New data collected relating to gender estimated that 28% of people in the Canadian space sector identify as female, and 72% identify as male. In , 63% of the total workforce were STEM (science, technology, engineering and mathematics) related employees and 66% were highly qualified personnel (HQP) (defined as employees in possession of at least a bachelor's degree). Academic organizations contributed 22% of the total space sector workforce with 2,370 FTEs, of whom 84% were HQP and 97% were STEM.
Business expenditures on R&D (BERD) totalled $376M in , with 87 companies undertaking space R&D projects. This represents a 5% increase from results, with BERD up by $20M. The return on investment (ROI) revealed that for CSA space development programs, for every dollar invested, 2.5 dollars are returned through follow-on revenues – a multiplier of 2.5 times. Space sector organizations reported a total of 243 new inventions and 66 new patents registered in .
In , the top 30 Canadian space organizations, which included 4 universities and 22 small and medium enterprises (SMEs), generated 96% of total space revenues and represented 74% of space employment. They also accounted for 83% of BERD and 38% of registered patents, but only 19% of inventions.
SMEs accounted for 94% of all Canadian space companies in . Together, SMEs accounted for 42% of Canadian space sector revenues and 29% of all employees.

Graduation day
On , CSA astronauts Jenni Sidey-Gibbons (fourth from left) and Joshua Kutryk (second from left) celebrated the end of their basic training, along with their NASA classmates, during a ceremony at the Johnson Space Center in Houston, Texas. () (Credit: NASA)
2. COVID-19
Key Results
- COVID-19 had a significant negative impact on company revenues, demand for services, employment, and supply chain operations across the Canadian space sector.
- Larger companies appear to have been affected more significantly than smaller companies.
- Employment is one notable area that had the least negative impacts, due in part to government support programs.
The delayed launch of the survey this year allowed for an initial and prospective analysis of possible COVID-19 impacts on the Canadian space sector in . Respondents to the survey were posed a set of questions comparing – with –.
Respondents were asked to categorize impacts on a Likert scale ranging from: Large Positive, Medium Positive, Small Positive, No Impact, Small Negative, Medium Negative, Large Negative. Summary results are distilled into the following: Positive, No Impact, and Negative.
Data in this section are further organized according to the size of the organization in order to display the nuances of COVID-19 impacts.
Organization size is determined by the number of employees: Large (500+), Medium (100–499), Small (10–99), Micro (1–9)
How much has COVID-19 impacted your revenues from – as compared to –?
| Positive | No Impact | Negative | |
|---|---|---|---|
| Percentage | 7% | 7% | 86% |
| Positive | No Impact | Negative | |
|---|---|---|---|
| Percentage | 5% | 16% | 79% |
| Positive | No Impact | Negative | |
|---|---|---|---|
| Percentage | 9% | 20% | 71% |
| Positive | No Impact | Negative | |
|---|---|---|---|
| Percentage | 3% | 44% | 53% |
How much has COVID-19 impacted demand for your products or services in ?
| Positive | No Impact | Negative | |
|---|---|---|---|
| Percentage | 7% | 14% | 79% |
| Positive | No Impact | Negative | |
|---|---|---|---|
| Percentage | 11% | 16% | 74% |
| Positive | No Impact | Negative | |
|---|---|---|---|
| Percentage | 20% | 25% | 55% |
| Positive | No Impact | Negative | |
|---|---|---|---|
| Percentage | 6% | 44% | 50% |
How has COVID-19 impacted your employment level (i.e. the number of full-time equivalents in your company)?
| Positive | No Impact | Negative | |
|---|---|---|---|
| Percentage | 0% | 43% | 57% |
| Positive | No Impact | Negative | |
|---|---|---|---|
| Percentage | 5% | 47% | 47% |
| Positive | No Impact | Negative | |
|---|---|---|---|
| Percentage | 12% | 52% | 36% |
| Positive | No Impact | Negative | |
|---|---|---|---|
| Percentage | 3% | 69% | 28% |
If applicable, have you experienced supply chain disruptions in because of COVID-19? If so, to what degree?
| Positive | No Impact | Negative | |
|---|---|---|---|
| Percentage | 9% | 18% | 73% |
| Positive | No Impact | Negative | |
|---|---|---|---|
| Percentage | 0% | 19% | 81% |
| Positive | No Impact | Negative | |
|---|---|---|---|
| Percentage | 0% | 30% | 70% |
| Positive | No Impact | Negative | |
|---|---|---|---|
| Percentage | 0% | 50% | 50% |
Overall, significant impacts have been felt across the space sector as a result of COVID-19. Over the – timeframe, revenues decreased for the vast majority of companies while demand for space-related products and services declined. Substantial negative impacts were recorded with regard to employment, and supply chain disruptions have had a noteworthy impact on company operations.
Organizations that are smaller in size appear to have been more adaptable to the challenging circumstances presented by the pandemic. Large companies recorded the most significant negative impacts, while smaller companies recorded the least negative effects.
Reverberations from the economic shutdown during the pandemic have had a tremendous impact on the space economy in Canada. Government support for companies appears to have been helpful in staving off further losses in employment based on data from respondents that identified as having used the Canada Emergency Wage Subsidy program.
Responses to the COVID-19 questions in the survey suggest that despite positive media for the space sector during the pandemic, a majority of space companies in Canada have experienced negative impacts on their operations.
3. Economic Impact Analysis
In this section
Key Result
- In , the space sector contributed $2.5B to Canada's GDP and supported a total of 22,879 jobs.
The methodology used for the following economic impact analysis is detailed in Annex B.
Economic Impact – Gross Domestic Product
In , the space sector contributed $2.5B to Canada's GDP, which represents the value of all final goods and services produced by the space sector within Canada. Total GDP contribution was broken down into the following:
- $1.30B in space sector impacts;
- $0.60B in supply industry impacts; and
- $0.57B in impacts related to consumer spending by associated employees.
The space sector creates benefits in the larger economy with a GDP multiplier of 1.90 (Total GDP Impact / Space Sector GDP Impact). In other words, every dollar that the space sector contributed to the GDP resulted in an additional $0.90 in GDP contributions from the larger economy.
| Space Sector | Supply Industry | Consumer Spending | |
|---|---|---|---|
| $B in | 1.30 | 0.60 | 0.57 |
Economic Impact – Jobs Supported
In , the space sector supported a total of 22,879 jobs in Canada. The total workforce contribution was broken down into the following:
- 10,541 space sector jobs;
- 6,482 supply industry jobs; and
- 5,856 jobs created and supported as a result of consumer spending by associated employees.
The space sector therefore creates jobs in the larger economy with a workforce multiplier of 2.17 (Total Workforce Impact / Space Sector Workforce Impact). In other words, every job in the space sector supports an additional 1.17 jobs in the economy.
| Space Sector | Supply Industry | Consumer Spending | |
|---|---|---|---|
| Workforce in | 10,541 | 6,482 | 5,856 |
4. Overall Results
In this section
Key Results
- In , total revenues in the Canadian space sector reached $5.5B.
- Ontario and Quebec maintained the highest space revenues, but the Prairies continued to experience the highest revenue growth in .
- The Canadian space workforce increased by 10% in , and totalled 10,541 space-related FTEs. The increase is primarily driven by an increased response rate and higher levels of funding at universities.
- The Canadian space sector workforce is predominantly made up of people who identify as male (72%), with those identifying as female representing the remaining 28% of the workforce.
- Quebec and Ontario together accounted for 75% of space sector jobs.
- The STEM workforce experienced significant growth in , rising by 15% to 6,643 FTEs and accounting for 63% of the total Canadian space workforce.
- HQP (employees with at least a bachelor's degree) accounted for 66% of the workforce and totalled 6,936 FTEs.
Total Revenues
In , total revenues in the Canadian space sector declined slightly, totalling $5.5B, a 3.2% (-$181M) decline year-over-year. The average annual growth rate of the space sector between and was 0.89%.Footnote 1 A detailed analysis of the source of this growth can be found in the section of this report on Revenues by Markets and Customers.
Of note, the findings presented throughout this report are provided at current prices (i.e. unadjusted for inflation).
| Revenues | 5,298 | 5,530 | 5,595 | 5,671 | 5,489 |
|---|
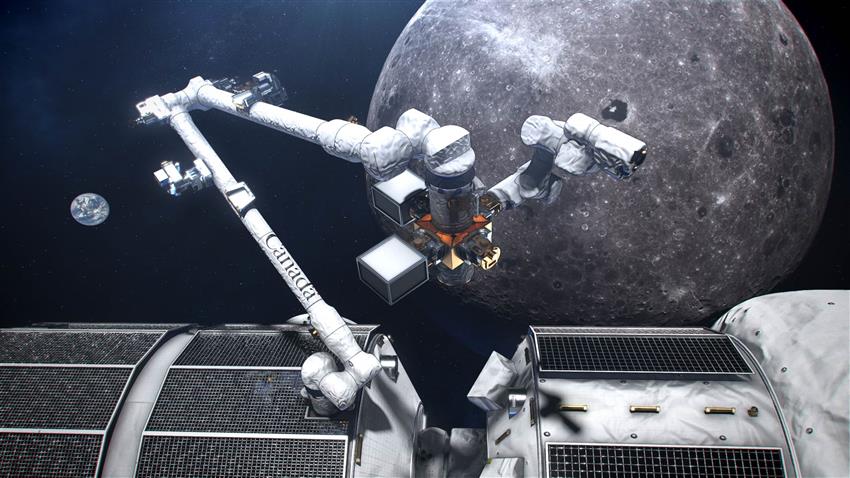
Canadarm3, Canada's smart robotic system for the Lunar Gateway
An artist's concept of Canadarm3's large arm on the Lunar Gateway. () (Credits: CSA, NASA)
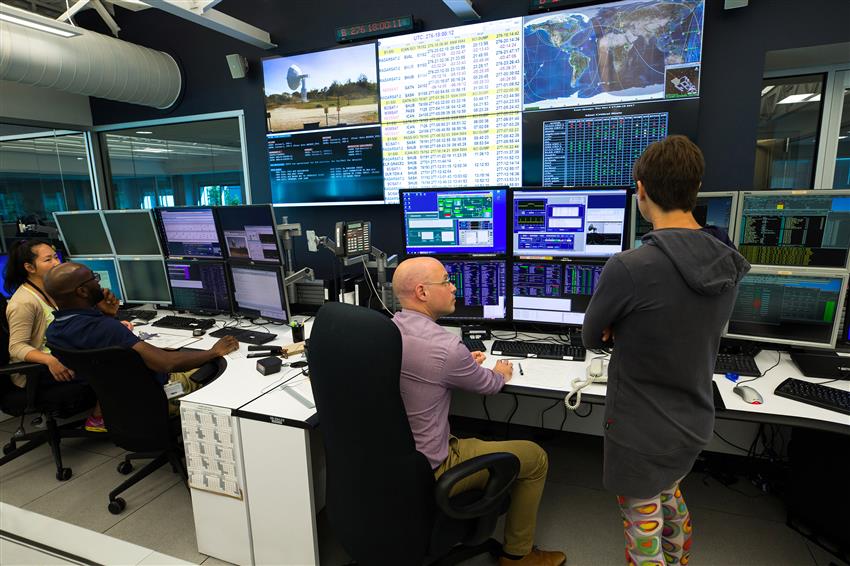
Satellite Operations Control Centre
Satellite Operations Control Centre of the Canadian Space Agency. (Credit: CSA)
Total Workforce
The space sector workforce totalled 10,541 FTEs in , a 10% increase, or +974 FTEs. The space sector workforce consists of 53% of FTEs in the upstream segment and 47% of FTEs in the downstream segment.
Note that workforce data do not include government employees. While the CSA employed 678 employees in , this number does not include government employees in other departments (e.g. Department of National Defence or Natural Resources Canada) that also work on space-related matters or use space-based data to deliver services to Canadians.
| Industry | 7,930 | 8,012 | 8,336 | 7,658 | 8,171 |
|---|---|---|---|---|---|
| Academia | 1,997 | 1,871 | 1,606 | 1,909 | 2,370 |
Gender Distribution of Employees
In , the CSA adjusted the gender question in the workforce section of the survey. The question asked for respondents to identify the gender breakdown of their space-related employees by percentage, under the headings Male, Female, and Other. The previous survey asked for a breakdown of new space-related employees.
In total, 140 organizations responded to the workforce section on gender, representing 67% of companies surveyed. Results indicated that the Canadian space sector workforce is predominantly made up of people who identify as male (72%). Those who identify as female represented the remaining 28% of the workforce. The Other category received very few responses, accounting for only 0.2% of employees in the Canadian space sector.
| Men | Women | Other | |
|---|---|---|---|
| Gender distribution | 72% | 28% | 0.2% |
Analyses across multiple dimensions of the Canadian space sector were completed to determine if there are particular trends among genders. When comparing gender along the value-chain and sectors of activity, there appears to be minimal fluctuation, with no more than +/-6% (from the average) between the different categories.
Notable differences include a higher predominance of those who identify as female in the Services portion of the value-chain at 33%, as well as in the Navigation (33%) sector of activity when compared with the average of those who identify as female. Those who identify as male were most concentrated in the Satellite Operations (75%) and Products and Applications (76%) section of the value-chain. Those who identify as male were also overly represented in the Space Exploration (78%) sector of activity.
| Gender | Research, Engineering and Consulting |
Ground Segment Manufacturing |
Space Segment Manufacturing |
Satellite Operations |
Services | Products and Applications |
|---|---|---|---|---|---|---|
| Male | 71.0% | 72.2% | 72.1% | 74.5% | 66.7% | 75.6% |
| Other | 0.1% | - | - | - | 0.5% | 0.1% |
| Female | 28.8% | 27.8% | 27.9% | 25.5% | 32.7% | 24.3% |
| Gender | Earth Observation |
Navigation | Other | Satellite Communication |
Space Exploration |
Space Science |
|---|---|---|---|---|---|---|
| Male | 75.1% | 66.9% | 68.8% | 70.6% | 78.2% | 70.3% |
| Other | - | - | - | 0.3% | - | 0.3% |
| Female | 24.9% | 33.1% | 31.2% | 29.1% | 21.8% | 29.4% |
Statistics Canada Linkable File Environment
The CSA recently collaborated with Statistics Canada through the Linkable File Environment (LFE) to produce statistics relevant to the Canadian space sector. The LFE is a system that enables other government departments and academia to link datasets with Statistic Canada's, in order to produce customized data tables and analyses. Through the LFE, other government departments can perform analyses using datasets such as the Business Register, Canada Revenue Agency administrative data, and business surveys.
The analysis using the Statistics Canada LFE revealed that companies in the Canadian space sector (excluding broadcasting) have an average employee salary of $74,000. Broadcasting was excluded for purposes of data consistency.
Average salaries in space outpace Aerospace, Information and Communication Technology (ICT) sectors, as well as the broader Canadian Average across the economy.
| Canadian Average |
ICT | Aerospace | Space | |
|---|---|---|---|---|
| Average salary (in thousands $) | 45 | 59 | 56 | 74 |
The Satellite Communication sector had on average, the highest salaries for employees at $95,000, while science and exploration had the lowest average salaries at $67,000.
| SatCom | Other | Science & Exp. |
EO | All Space | |
|---|---|---|---|---|---|
| Average salary (in thousands $) | 95 | 68 | 67 | 78 | 74 |
Medium-sized companies (100–499 employees) pay the highest average salary at $84,000, followed by small companies (1–99 employees) at $76,000, and paying the lowest relative salary were large companies (500+ employees) with salaries averaging $62,000.
Gender: Statistics Canada Linkable File Environment
Utilizing the LFE, an analysis of CEO genders was assessed across Canadian space sector companies. Sixty-three percent of Canadian space sector company CEOs identify as male, 13% identify as female,
| Canadian Average |
ICT | Aerospace | Space | |
|---|---|---|---|---|
| Male | 62 | 75 | 79 | 63 |
| Female | 18 | 15 | 7 | 13 |
| Unknown | 20 | 10 | 14 | 25 |
CEOs who identify as female are present in larger numbers in small and large firms when compared to medium-sized firms. Those who identify as female are equally as likely to be CEOs of either small or large firms, but are non-existent in the medium-sized firms.
Occupations
The CSA divides the space workforce into eight main occupation categories: Engineers and Scientists, Technicians, Management, Administration, Marketing and Sales, Students, Health Professionals, and Other Employees.
In , engineers and scientists comprised the largest category of employment with 3,498 FTEs, representing 33% of the total space workforce. Employees in the administration category made up the second largest group with 2,546 FTEs, accounting for 24% of the workforce. Technicians accounted for 11% of the workforce with 1,142 FTEs. Management, marketing and sales, students, and other employees made up the remainder.
| Management | Engineers and Scientists |
Technicians | Marketing and Sales |
Administration | Students/ Interns |
Other (inc. Health Professionnals) |
|
|---|---|---|---|---|---|---|---|
| 7% | 33% | 11% | 5% | 24% | 12% | 8% |
STEM Employees
The STEM indicator tracks the number of engineers, scientists, technicians, management, health professionals and students working in the space sector. STEM employees totalled 6,643 FTEs and represented 63% of the total Canadian space workforce, but there are significant differences between the upstream and the downstream segments: 85% of the workforce in the upstream segment are STEM, while only 38% of the workforce in the downstream segment are STEM.
Definition of STEM Employees
- STEM = Engineers, scientists, technicians, management, health professionals, and students
The breakdown of the STEM workforce by region largely followed the regional breakdown of the total space workforce. The majority of STEM employees can be found in Ontario and Quebec, which accounted for 44% (2,904 FTEs) and 25% (1,690 FTEs) of Canada's STEM workforce, respectively. The Prairies (Alberta, Saskatchewan and Manitoba) followed with 16% (1,030 FTEs) of Canada's STEM workforce. B.C. accounted for 10% (654 FTEs) of Canada's STEM workforce, while the Atlantic region (New Brunswick, Prince Edward Island, Newfoundland and Nova Scotia) accounted for 6% (366 FTEs) of Canada's STEM workforce.
Of particular note is the number of STEM employees by region. In the Prairies and B.C., STEM employees accounted for 92% and 88% of the provincial space workforce, respectively. STEM employees accounted for 65% of the space workforce in Ontario, 50% in Quebec and 46% in Atlantic Canada. A lower share of STEM employees often reflects an industry that includes more downstream companies (especially broadcasting companies), which tend to employ a higher number of administrative employees.
| Ontario | Quebec | Atlantic | British Columbia | Prairies | |
|---|---|---|---|---|---|
| 44% | 25% | 6% | 10% | 15% |
| British Columbia | 654 |
|---|---|
| Prairies | 1,030 |
| Ontario | 2,904 |
| Quebec | 1,690 |
| Atlantic | 366 |
| Total | 6,644 |
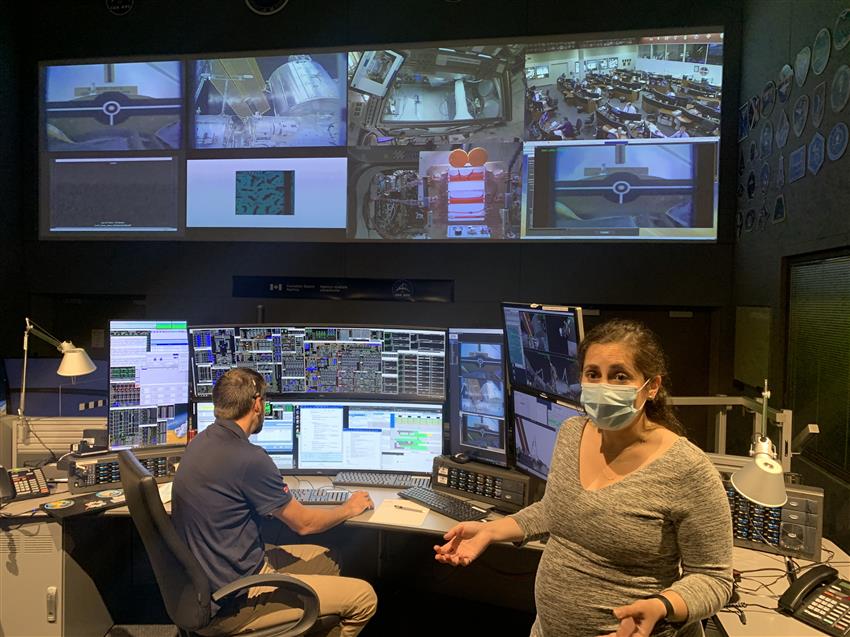
Junior Astronaut Camp
Flight Controller Jason Seagram, who was operating Canadarm2 live during the CSA's first ever Junior Astronaut Camp. () (Credit: CSA)
Highly Qualified Personnel (HQP)
In , HQP accounted for 66% of Canada's space workforce, or 6,936 FTEs. While 77% of the upstream workforce are HQP, only 54% of the downstream workforce are HQP.
Definition of HQP Employees
- HQP = Employees having completed at least a bachelor's degree
Overall, 44% (3,068) of Canada's HQP worked in Ontario in , while 28% (1,976) of them worked in Quebec. The Prairies accounted for 11% (771) of Canada's HQP. B.C. and the Atlantic region accounted for 9% (630) and 7% (492) of Canada's HQP, respectively.
In B.C., HQP accounted for 85% of the workforce, the highest proportion in Canada. HQP accounted for 69% of the workforce in the Prairies, 68% in Ontario, 62% in Atlantic Canada and 58% in Quebec.
Our previous definition of HQP tracked the numbers of engineers, scientists and technicians in the Canadian space sector. According to this definition, the number of engineers, scientists and technicians increased by 13%, or 520 FTEs, year-over-year, numbering 4,639 employees in .
| Ontario | Quebec | Atlantic | British Columbia | Prairies | |
|---|---|---|---|---|---|
| 44% | 29% | 7% | 9% | 11% |
| Total Workforce |
Total HQP | % of HQP Relative to Total Regional Workforce |
% of HQP Relative to Total Number of HQP in Canada's Space Workforce |
|
|---|---|---|---|---|
| British Columbia | 739 | 630 | 85% | 9% |
| Prairies | 1,116 | 771 | 69% | 11% |
| Ontario | 4,497 | 3,068 | 68% | 44% |
| Quebec | 3,394 | 1,976 | 58% | 29% |
| Atlantic | 795 | 492 | 62% | 7% |
| Total | 10,541 | 6,936 | 100% | 100% |
Space Labour Force Challenges and Needs
In , 34% of Canadian space companies faced difficulties hiring personnel to the extent that positions went unfilled. The professions for which companies had the most difficulties finding employees were engineers, scientists and technicians, as well as marketing and sales personnel. The two main reasons highlighted for hiring difficulties were competition from other industrial sectors for the same talent, followed by applicants lacking the skills required for the position.
Companies dealing with employee shortages used three main strategies to deal with the problem: they provided internal training to their employees, they shared the workload amongst existing employees and they outsourced some of the work.
Over the next five years, Canadian space companies will be looking for employees with sought-after skills related to software development, electrical engineering systems, mechanical engineering systems, as well as business development and commercialization.
Regional Distribution and Trends
The proportional share of total revenues and employment by province remained relatively stable from year to year.
| Ontario | Quebec | Atlantic | British Columbia | Prairies | |
|---|---|---|---|---|---|
| 59% | 24% | 8% | 3% | 6% |
| B.C. | Prairies | Ontario | Quebec | Atlantic | |
|---|---|---|---|---|---|
| Percentage change | -42% | 42% | 17% | -22% | 4% |
| Domestic | Export | Domestic | Export | |
|---|---|---|---|---|
| British Columbia | $103 | $112 | $61 | $102 |
| Prairies | $40 | $271 | $51 | $317 |
| Ontario | $1,878 | $1,398 | $1,832 | $1,393 |
| Quebec | $1,165 | $288 | $1,015 | $287 |
| Atlantic | $208 | $207 | $222 | $209 |
| Total | $3,394 | $2,277 | $3,180 | $2,309 |
Revenues by Region
British Columbia
In , British Columbia had revenues of $163M, a decline of 24% ($52M) over revenues. Domestic revenues declined by 41%, or $42M, from $103M in to $61M in . Export revenues also declined by 9%, or $10M, from $112M to $102M between and .
Between and , B.C.'s total revenues decreased by 42% from $281M to $163M. This decline was driven by a 65% decline in domestic revenues, from $174M to $61M. Over the same period, export revenues contracted by 4%, from $106M to $102M.
B.C. accounted for 3% of Canadian space sector revenues in . There were twice as many upstream organizations in B.C. as downstream organizations. Upstream segment organizations generated 67% of the province's space revenues, and downstream segment organizations generated 33% of the province's space revenues. B.C. is the only province where the upstream segment generates more revenues than the downstream segment.
Prairies (Alberta, Saskatchewan and Manitoba)
Revenues in the Prairies increased by 18% ($57M) in and totalled $368M. Domestic revenues grew by 28%, or $11M, from $40M in to $51M in ; export revenues increased by 17%, from $271M in to $317M in .
- Alberta's revenues increased by 6%, or $15M, from $238M to $253M.
- Saskatchewan's revenues increased by 84%, or $46M, from $54M to $100M.
- Manitoba's revenues declined by 17%, or $3M, from $18M to $15M.
Between and , total revenues grew by 42%, from $259M in to $368M in . Domestic revenues declined by 25%, from $68M in to $51M in ; exports grew by 66%, from $192M to $317M, in the same period.
The Prairies accounted for 7% of Canadian space sector revenues in . Revenues in the upstream segment accounted for 39%, while 61% came from the downstream segment.
Ontario
Revenues in Ontario declined by 2%, or $51M, in and totalled $3.22B. Domestic revenues decreased by 2%, or $46M, totalling $1.83B, while exports remained consistent at $1.39B in .
Total revenues in Ontario increased by 17% between and . This growth was driven by export revenues, which grew by 52%, from $916M to $1.39B. Domestic revenues were relatively flat, declining by 1% and maintaining $1.83B from to .
Ontario accounted for 59% of Canadian space sector revenues in . Two-thirds of Ontario space organizations worked in the upstream segment. However, downstream segment organizations accounted for 87% of revenues in the province due to significant revenue in satellite operations, manufacturing of satellite communication hardware (such as satellite terminals), and broadcasting services. Upstream organizations accounted for the remaining 13% of revenues.
Quebec
Revenues in Quebec declined by 10%, or $151M, in , totalling $1.3B. Domestic revenues decreased by 13%, or $150M, from $1.2B in to $1.0B in ; exports were constant at $288M in and $287M in .
Between and , Quebec's total revenues decreased by 22%, from $1.67B to $1.30B. This was driven by a 30% decline in domestic revenues, which went from $1.44B in to $1.02B in . Export revenues grew by 28%, from $225M to $287M over the same period.
Quebec accounted for 24% of Canadian space sector revenues in . Quebec had almost six times as many upstream segment organizations as downstream segment organizations, while revenues were heavily concentrated in the downstream segment (79%) rather than in the upstream (21%).
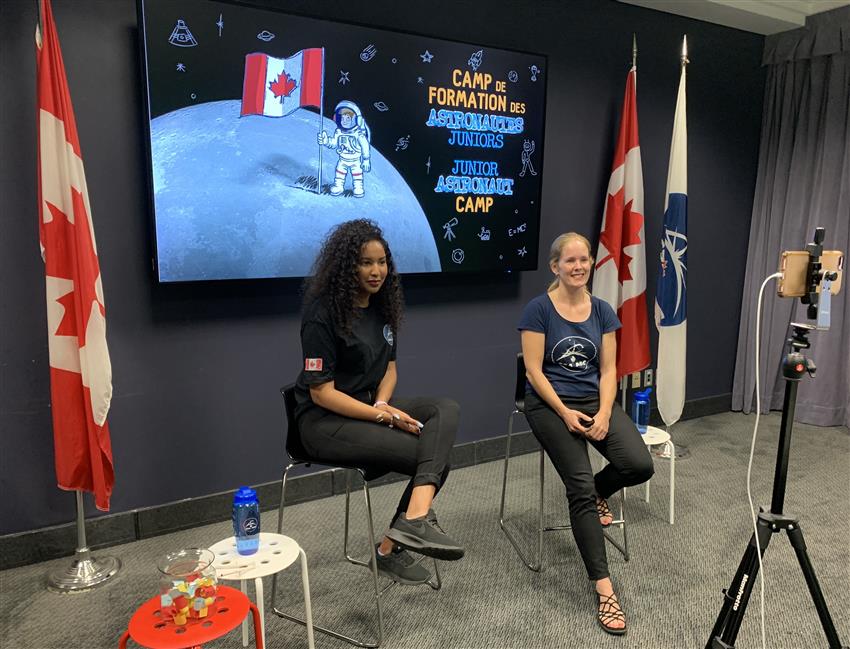
Day 1: Junior Astronaut Camp
Engineers Miriam Micael and Jamie Sevigny, the camp leaders, welcome the participants live from CSA headquarters. (Credit: CSA)
Atlantic Canada (New Brunswick, Newfoundland and Nova Scotia)
In , revenues in the Atlantic region increased by 4%, or $16M, from $415M in to $431M in . Export revenues remained relatively constant with no growth, from $207M in to $209M in . Domestic revenues grew by 7%, or $14M, from $208M in to $222M in .
- Revenues in Newfoundland grew by 1% in and totalled $226M.
- Revenues in New Brunswick grew by 7% year-over-year, with revenues reaching $201M.
- Revenues in Nova Scotia and Prince Edward Island increased by 1% in and totalled $4.7M.
Between and , total revenues in the Atlantic region grew by 29%, or $96M, from $335M in to $431M in , due to significant growth in both domestic and export revenues. Domestic revenues grew by 24%, from $179M in to $222M in , while export revenues grew by 34%, from $156M in to $209M in .
The Atlantic region accounted for 8% of Canadian space sector revenues in . In Atlantic Canada, there are a few small to medium-sized upstream segment players, which are mainly in academia, and a handful of downstream segment organizations. Downstream segment organizations accounted for 97% of revenues in , and upstream segment organizations accounted for the remaining 3%.
Workforce by Region
- British Columbia: 7% (739 FTEs) of Canada's space workforce, an increase of 16% (101 employees) over last year.
- Prairies: 11% (1,116 FTEs), an increase of 16% (150 employees).
- Ontario: 43% (4,497 FTEs), an increase of 11% (450 employees).
- Quebec: 32% (3,394 FTEs), an increase of 7% (212 employees).
- Atlantic Canada: 8% (795 FTEs), an increase of 8% (61 employees).
| Engineers & Scientists |
Technicians | Management | Administration | Marketing and Sales |
Students/ Interns |
Health Professionals |
Other | Total | % of Total Workforce |
|
|---|---|---|---|---|---|---|---|---|---|---|
| B.C. | 426.3 | 85.0 | 67.7 | 39.0 | 30.0 | 74.5 | 0.0 | 16.0 | 739 | 7% |
| Prairies | 530.8 | 104.0 | 80.2 | 59.0 | 20.0 | 304.8 | 10.0 | 7.0 | 1,116 | 11% |
| Ontario | 1,427.5 | 473.7 | 361.0 | 878.0 | 233.8 | 633.3 | 8.0 | 482.0 | 4,497 | 43% |
| Quebec | 930.0 | 412.0 | 168.0 | 1,414.0 | 131.0 | 179.0 | 1.0 | 159.0 | 3,394 | 32% |
| Atlantic | 183.0 | 67.0 | 49.0 | 156.0 | 100.0 | 67.0 | 0.0 | 173.0 | 795 | 8% |
| Total | 3,497.6 | 1,141.7 | 725.9 | 2,546.0 | 514.8 | 1,258.6 | 19.0 | 837.0 | 10,541 | 100% |
5. Revenues by Markets and Customers
In this section
Key Results
- In , the upstream segment generated roughly $0.9B in revenues, while the downstream segment generated $4.6B in revenues.
- The Services sub-segment continues to account for the majority of revenues. Growth in Ground Segment Manufacturing resulted from an increase in exports, and growth in Research, Engineering and Consulting was largely a result of increased funding and responses from universities. Declines in Products and Applications were anticipated due to a minor reclassification of activities by organizations.
- In terms of sectors of activities, 83% of revenues came from Satellite Communication. Space Science growth was largely a result of an increased response rate and its small composition. Declines in Navigation were expected due to a minor reclassification of activities by organizations.
- Growth in the Canadian space sector is driven by a +9.7% increase in exports annually from to .
- Canadian space exports increased slightly by 1.4%, remaining at $2.3B. The U.S. remained the main export destination, accounting for 56% of space export revenues.
Market Share by Value-Chain Segments
Space sector revenues can be broken down into value-chain segments and sub-segments based on the type of work that the organization is carrying out. The two main segments this analysis has been bifurcated into are upstream and downstream activities. The upstream segment – comprised of the research, engineering and consulting as well as the space segment manufacturing and ground segment manufacturing sub-segments – generated $0.9B in revenues in . The downstream segment – comprised of the satellite operations, manufacturing of products (e.g. terminals), development of software applications, and the provision of services (e.g. broadcasting) sub-segments – generated $4.6B in revenues in .
In , significant growth and contractions were noted across the value chain. Research, Engineering and Consulting growth (+33%) was primarily associated with an increased response rate and funding at universities. Ground Segment Manufacturing increased dramatically (+72%) due largely to a significant increase in exports. The decline in Products and Applications (-22%) was expected due to a minor reclassification of activities by some organizations to other segments of the value-chain.
A detailed description of the value-chain categorization is provided in Annex C. Revenues in each sub-segment can be broken down as follows:
- Research, Engineering and Consulting amounted to $293M in , a 33% growth ($73M) from . This sub-segment accounted for 5% of total revenues in .
- Space Segment Manufacturing amounted to $332M in , a decrease of 20% (-$83M) from . It accounted for 6% of total revenues.
- Ground Segment Manufacturing amounted to $306M in , a 72% increase ($128M) from . It accounted for 6% of total revenues.
- Satellite Operations amounted to $957M in , a 3% increase ($29M) from . It accounted for 17% of total revenues.
- Products and Applications reached $1.1B in , a 22% decline (-$293M) from . It accounted for 19% of total revenues.
- Services amounted to $2.5B in , a 1% decline (-$36M) from . It accounted for 46% of total revenues in .
| Research, Engineering and Consulting | Space Segment Manufacturing | Ground Segment Manufacturing | Satellite Operations | Products and Applications | Services | |
|---|---|---|---|---|---|---|
| 5% | 6% | 6% | 18% | 19% | 46% |
Market Share by Sector of Activity
In , slight declines in revenues occurred across all sectors, with the exception of revenue growth in Space Science. Revenues remained relatively stable in Satellite Communication and Space Exploration. Trends for the – period are detailed below.
Satellite Communication
In , Satellite Communication generated $4.6B in revenues, accounting for 83% of total space revenues. The vast majority (88%) of Satellite Communication revenues was derived from activities in the downstream segment, broken down as follows:
- Satellite Operations: $932M
- Products and Applications (e.g. antennas): $748M
- Broadcasting Services: $2.0B
- All other telecommunication services: $300M
The remainder of Satellite Communication revenues (12%) was related to upstream segment activities:
- Research, Engineering and Consulting: $58M
- Space Segment Manufacturing: $237M
- Ground Segment Manufacturing: $239M
Satellite Communication revenues declined by 1%, or $56M, in . Between and , Satellite Communication revenues experienced 2% growth, or $102M, from $4.5B to $4.6B.
Earth Observation (EO)
In , EO revenues totalled $248M, accounting for 4% of total space revenues. The majority of EO revenues (60%) was in the upstream segment:
- Research, Engineering and Consulting: $47M
- Space Segment Manufacturing: $44M
- Ground Segment Manufacturing: $57M
The remainder of revenues (40%) was related to activities in the downstream segment:
- Satellite Operations: $22M
- Products and Applications: $40M
- Services: $37M
EO revenues declined by 11%, or $30M, in . Between and , EO revenues experienced a decline of 41%, or $175M, from $423M to $248M.
Space Exploration
Space Exploration revenues totalled $119M in , accounting for 2% of total space revenues. The upstream segment accounted for 90% of Space Exploration revenues, distributed as follows:
- Research, Engineering and Consulting: $81M
- Space Segment Manufacturing: $22M
- Ground Segment Manufacturing: $4.3M
The remainder of revenues was related to activities in the downstream segment:
- Satellite Operations: $0.2M
- Products and Applications: $11M
- Services: $0.8M
Space Exploration revenues contracted by 3%, or $4M, in . Between and , revenues from Space Exploration grew by 6%, or $7M, from $112M to $119M.
Navigation
Navigation revenues reached $418M in , which amounted to 8% of total space revenues. In Canada, 98% of space activities related to Navigation are in the downstream segment. Navigation revenues are broken down as follows:
- Satellite Operations: $0.2M
- Products and Applications: $259M
- Services: $152M
The remainder of activities, which relate to the upstream segment, amounts to roughly $7M, divided as follows:
- Research, Engineering and Consulting: $4.4M
- Space Segment Manufacturing: $0.7M
- Ground Segment Manufacturing: $1.9M
From to , revenues decreased by 25%, or $141M. Fluctuations in Navigation revenues from to are primarily attributable to a minor reclassification of activities by survey respondents, with the declines in Navigation being moved to non-broadcasting Satellite Communication Services. Between and , revenues from Navigation increased by 103%, or $212M, from $206M to $418M.
Space Science
In , Space Science revenues totalled $111M, which represents 2% of total space revenues. The majority of space science revenues was in the upstream segment:
- Research, Engineering and Consulting: $91M
- Space Segment Manufacturing: $12M
- Ground Segment Manufacturing: $0.6M
With the remainder in the downstream segment:
- Satellite Operations: $2.8M
- Products and Applications: $3.4M
- Services: $0.7M
Space Science increased dramatically in , growing 68% to $111M. The increased response rate and small size of the Space Science segment makes it more susceptible to fluctuations from major investments, and therefore the substantial year-over-year growth is not unexpected. Between and , revenues from Space Science increased by 58%, or $41M, from $70M to $111M.
Other Revenues
From to , other revenues grew by 7%, from $29M to $31M, and accounted for 1% of total space revenues. Activities that fall into the "Other
" sector are by nature variable and subject to re-categorization; therefore, changes in this sector are less statistically relevant than for the previously noted sectors.
| Satellite Communication |
Navigation | Space Exploration |
Earth Observation |
Space Science |
Other | |
|---|---|---|---|---|---|---|
| 83% | 8% | 2% | 4% | 2% | 1% |
| Research, Engineering and Consulting |
Space Segment Manufacturing |
Ground Segment Manufacturing |
Satellite Operations | Products and Applications |
Services | |
|---|---|---|---|---|---|---|
| 1% | 5% | 6% | 18% | 19% | 46% |
| Satellite Communication |
Navigation | Space Exploration |
Earth Observation |
Space Science |
Other | |
|---|---|---|---|---|---|---|
| Percentage change | 2% | 103% | 6% | -41% | 58% | 13% |
Market Share by Customer Location
Domestic vs. Export Revenues
In , Canadian space revenues totalled $5.5B, of which 58% ($3.2B) were from domestic sources and 42% ($2.3B) were from exports. Domestic revenues declined by 6.3%, or $213M, in ; exports meanwhile grew by 1%, or $32M.
The compound annual growth rate (CAGR) between and was +0.9% for the entire space sector, -3.7% for domestic revenues, and +9.7% for exports.
Broadcasting is a large contributor to the space economy but is in continued decline as reflected in the divergence in numbers when broadcasting is excluded vs. included in the analysis. When excluding broadcasting, total revenues generated by the Canadian space sector grew from $2.7B in to $3.4B in . With the exclusion of broadcasting, the CAGR between and was 5.9% for the entire space sector, -0.2% for domestic revenues and +9.7% for exports.
| Domestic Revenues | Export Revenues | |
|---|---|---|
| 3,704 | 1,594 | |
| 3,545 | 1,985 | |
| 3,475 | 2,120 | |
| 3,394 | 2,277 | |
| 3,180 | 2,309 |
| Domestic Revenues | Export Revenues | |
|---|---|---|
| $3,704,150,826 | $1,594,323,346 | |
| $3,545,430,399 | $1,984,715,754 | |
| $3,475,200,911 | $2,120,153,923 | |
| $3,393,663,363 | $2,276,926,547 | |
| $3,180,456,444 | $2,308,782,280 |
| Total Revenues | Total Revenues (Excluding Broadcasting) |
|
|---|---|---|
| 5,298 | 2,735 | |
| 5,530 | 3,079 | |
| 5,595 | 3,264 | |
| 5,671 | 3,456 | |
| 5,489 | 3,441 |
Export Regions
Export revenues remained consistent at $2.3B in ; however, the majority of regional exports declined with the exception of a significant increase in Asia.
The U.S. remained the main destination for Canadian space exports, totalling 56% of total exports. Revenues derived from exports to the U.S. contracted by 1%, or $10M, from $1.3B in to $1.29B in .
Europe remained Canada's second largest market for space exports. Canadian exports to Europe declined by 3%, or $14M, from $451M in to $437M in . Europe accounted for 19% of total exports.
Exports to Asia increased by a significant 29%, or $81M, from $282M in to $363M in . Asia accounted for 16% of total exports.
Exports to South America remained flat with no growth (-$0.6M), from $118M in to $117M in . The region accounted for 5% of total exports.
Exports to Central America, the Caribbean and Mexico declined by 23%, or $8.8M, from $39M in to $30M in . This region accounted for 1% of total export revenues.
Exports to Oceania decreased by 35%, or $8.5M, from $24M in to $16M in . Oceania accounted for 1% of total export revenues.
Export revenues from Africa decreased by 16%, or $4.0M, from $25M in to $21M in . Generally speaking, export growth to this region has been uneven; years of strong growth have been followed by declines and vice versa. Africa accounted for 1% of total Canadian space export revenues.
Finally, in , 2% of total exports, or $35M, were not allocated to a specific region of the world.
| United States | Europe | Asia | South America | Oceania | Africa | Central America, Caribbean, Mexico |
Other | |
|---|---|---|---|---|---|---|---|---|
| 56% | 19% | 16% | 5% | 1% | 1% | 1% | 1% |
| United States | 854 | 918 | 984 | 1,299 | 1,289 |
|---|---|---|---|---|---|
| Europe | 354 | 470 | 512 | 451 | 437 |
| Asia | 232 | 289 | 364 | 282 | 363 |
| South America | 100 | 96 | 119 | 118 | 117 |
| Africa | 8 | 21 | 27 | 25 | 21 |
| Oceania | 14 | 34 | 19 | 24 | 16 |
| Central America, Caribbean, Mexico | 7 | 29 | 34 | 39 | 30 |
| Other | 24 | 128 | 61 | 38 | 35 |
Market Share by Customer Type
Customers are categorized as either government or non-government. Government customers include domestic governments (municipal, provincial, federal) and foreign governments. Non-government customers include businesses, individual consumers and non-profit organizations or foundations (both domestic and foreign).
Overall, 11% of the space revenues in were derived from government customers and 89% from non-government customers. It is important to note that government customers make up the majority of market share in some sectors, such as Space Exploration and Space Science, whereas Satellite Communication customers are primarily non-government.
Upstream segment organizations derive the majority of their revenues from government clients, while downstream segment organizations derive their revenues almost exclusively from non-government clients. The upstream segment derived 62% of revenues from non-government clients in , whereas the downstream segment derived 94% of revenues from non-government clients. It is worth noting that some downstream segment organizations get a significant share of their revenues from government contracts. For example, EO downstream companies derived 42% of their revenues from government clients in (compared to 6% for downstream companies overall). In that respect, they are more likely to face similar challenges as companies in the upstream segment.
| Government | Non-Government | |
|---|---|---|
| Canadian space sector | 11% | 89% |
| Government | Non-Government | |
|---|---|---|
| Upstream segment | 38% | 62% |
| Government | Non-Government | |
|---|---|---|
| Downstream segment | 6% | 94% |

CAPCOM
Jenni Sidey-Gibbons guided astronauts Thomas Pesquet and Shane Kimbrough during their spacewalk. () (Credits: CSA, NASA)
Domestic Customer Breakdown by Type
In , 89% of domestic revenues were from non-government clients. Non-government customers can be individuals, such as subscribers to television and radio broadcasting services. Other non-government customers include businesses, where space-derived information products are integrated into business operations (e.g. Navigation and EO data). A small proportion of non-government revenues is tied to financing or sales to non-profit organizations and foundations.
Government customers make up the remaining 11% of the domestic market. Government customers represent the majority of domestic upstream revenue, where they constitute 83% of revenues. Government customers are mainly involved in the Research, Engineering and Consulting sub-segment. Non-government revenues constitute the remaining 17%. In the domestic downstream segment, the situation is reversed, as government customers account for only 3% of revenues.
The majority of government funding comes from federal sources. The top five sources of federal government revenue reported by space organizations in in order of funding size were the CSA, the Department of National Defence (DND), the Natural Sciences and Engineering Research Council (NSERC), the Canada Foundation for Innovation (CFI), and Public Services and Procurement Canada (PSPC).
| Federal Government | Municipal Government | Provincial Government | Non-Government | |
|---|---|---|---|---|
| 10% | 0.1% | 1% | 89% |
Foreign Customer Breakdown by Type
Non-government customers are the largest market segment abroad, accounting for 88%, or $2.0B, of export revenues. Foreign government clients make up the remaining 12%, or $277M, of exports. This is equally true for both the upstream and downstream segments, where non-government revenues account for 84% and 88% of revenues, respectively.
Exports to commercial clients are strong in three main areas of the value chain: Manufacturing, Satellite Operations, and Products and Applications. In terms of Manufacturing, several companies are producing components and parts for foreign prime companies through global value chains, with very occasional sales related to manufacturing of complete end-to-end space systems. Satellite Operations include primarily sales related to operations for commercial telecommunications systems. Products and Applications sold to non-government customers are mostly related to antennas, receivers and other ground equipment in the Navigation and Satellite Communication sectors. Non-government exports for EO are limited, but a small market does exist for data and software applications.
There is also a small portion of non-government entities, mainly foundations, that provide funding to Canadian universities and research centres. This is a relatively small amount, and it is categorized as export revenue in the consolidated analysis of the Canadian space sector.
| Government | Non-Government | |
|---|---|---|
| 12% | 88% |
6. Innovation
In this section
Key Results
- Business Expenditures on R&D (BERD) totalled $376M in , a 5% increase from the previous year.
- R&D intensity for space manufacturing was 13 times higher than the average for manufacturing in Canada.
- Canadian space companies derived $253M in revenues through the commercialization of externally funded R&D projects, an 11% decrease from .
- Space sector organizations reported a total of 243 inventions and 66 registered patents.
Business Expenditures on R&D (BERD) (Companies Only)
In , there were 87 companies engaged in R&D activities, with BERD reaching $376M. This represents a 5% increase from the $356M spent in BERD in . Upstream organizations were responsible for 49% of total space sector BERD.
R&D spending in was financed through internal sources (e.g. company profits reinvested in R&D) at 67%, while the remaining 43% was financed through external funding sources (e.g. government grants and contributions). Externally (i.e. government) funded R&D reached $161M in , and internally (i.e. company) funded R&D reached $214M.
| Large firms | SMEs | |
|---|---|---|
| Firm size | 54% | 46% |
| Upstream | Downstream | |
|---|---|---|
| Market segment | 49% | 51% |
R&D Intensity Level (Companies Only)
The R&D intensity indicator reflects the ratio of BERD spending relative to the GDP contribution of the space sector. It serves as an indicator of the level of effort and investment by a company (or by an industry as a whole) in innovative activities such as the creation of new products, services and technologies, or the improvement of business functions such as production techniques. Overall, space sector R&D intensity is 35%. The upstream segment is more R&D intensive than the downstream: upstream R&D intensity is 46%, while downstream R&D intensity is 29%. The R&D intensity for the manufacturing sub-segment (in the upstream) is 36%, which is 13 times higher than the average for manufacturing in Canada.

Canadian technology developed for astronomy helps detect cancer cells. (Credit: Nüvü Caméras)
Commercialization of Externally Funded R&D Projects (All Organizations)
Organizations report on the level of commercialization of projects that were initially funded by government (externally funded R&D). In , 41 organizations derived $253M in revenues through the commercialization of externally funded R&D projects, a 11% decline from commercialization revenues. The upstream segment accounted for 54% of commercialization revenues, while the downstream segment accounted for the remaining 46%. Almost all commercialization takes place through companies.
Return on Investment
For the past three years the CSA has been surveying companies to determine the return on investment (ROI) from CSA space development programs.
Definition of Return on Investment
- the ratio rate of return between net income and investment.
The response rate for the ROI section of the survey was high in , with 81% of respondents answering the ROI questions. Overall, 84% of respondent companies indicated that CSA-financed projects generated positive reputation benefits, 83% have attempted to generate follow-on revenues, and 87% intend to generate follow-on revenues.
The total ROI figure encompasses data collected from the – time period for projects that concluded in –. It is predicted that for each year beyond the completion of a project, opportunities for further follow-on revenues are generated, and therefore the ROI has the potential to continue growing over time.
- The total ROI to date for projects that finished in – is 2.5 : 1
- (for every $1.00 invested, companies generated $2.50 in additional follow-on revenues – a multiplier of 2.5 times)
- A total of 39% of projects that finished in – generated an ROI. Of the projects that generated an ROI:
- 23 had an ROI >1
- 14 had an ROI >5
- 8 had an ROI >10
The analysis is conservative in nature, as the projects for which companies did not provide responses are counted as generating an ROI of zero. CSA space development programs have demonstrated success in generating follow-on revenues for companies. The intent is to continue to follow CSA-funded projects that have ended in order to determine the cumulative total ROI for each space development project.
Inventions and Patents (All Organizations)
In , 57 organizations reported having made an invention and 25 registered a patent. Between and , the number of organizations with inventions and registered patents increased by 33% (from 43 organizations in ) and 14% (from 22 organizations in ), respectively. Between and , the number of organizations with inventions declined by 8% (from 62 to 57), while the number of organizations registering patents declined by 24% (from 33 to 25).
A total of 243 inventions and 66 registered patents were reported in . The number of inventions increased by 43%, from 170 in to 243 in . The number of registered patents increased by 25%, from 53 in to 66 in .
Upstream organizations accounted for the majority of inventions and registered patents, with 77% of all inventions reported and 64% of patents filed. This is a reflection of the composition of survey respondents, with almost three-quarters of respondents in the upstream segment. In , upstream organizations registered 42 patents and reported 186 inventions, while downstream organizations registered 24 patents and reported 57 inventions.

Visit from an interstellar traveller
Comet NEOWISE. Sky watchers from Earth and space alike gazed at and photographed the celestial object as it skimmed by our planet. (Credit: NASA)
7. Results by Types of Organizations
In this section
Key Results
- Canada's top 30 organizations accounted for 96% of total revenues and 74% of the total workforce in .
- Ninety-four percent of Canadian space companies were SMEs in ; they accounted for 42% of Canadian space sector revenues and 29% of all employees.
- University and research centre revenues amounted to $150M, representing 2.7% of total revenue. They contributed 22% of the total space sector workforce with 2,370 full-time equivalents.
Canada's Leading Space Organizations
In , Canada's top 30 space organizations (i.e. based on their revenues) generated 96% of space revenues and accounted for 74% of space employment, which is consistent with results from previous years despite changes in the composition and rank of the top 30 space organizations. Canada's top 30 organizations are comprised of 26 companies and 4 universities. The top 30 organizations account for 83% of BERD (companies only)38% of registered patents, and 19% of inventions. Most of the top 30 organizations were companies; however, four academic organizations were also represented. Sixty percent of the top 30 organizations were downstream companies, with the remaining 40% including upstream segment companies and universities.
By comparison, the top 10 organizations were companies which accounted for 84% of total space revenues and 55% of employment. Canada's top 10 organizations accounted for 71% of BERD, 7% of inventions and 23% of registered patents. Nine of the top 10 organizations were downstream segment companies.
Large companies, classified as having 500 employees or more, are rare in the space sector. Only 6% of the companies surveyed were classified as large enterprises in .
Seventy-five organizations reported space revenues in excess of $1M during .
Small and Medium-Sized Enterprises (SMEs)
Ninety-four percent of Canadian space companies were SMEs in , and many of Canada's top space companies were SMEs (defined as employing 1 to 499 workers). SMEs were concentrated most heavily in research, engineering and consulting activities in the upstream segment and in the production of products, applications and services in the downstream segment: 68% of SME respondents were upstream segment companies, while 32% were downstream segment companies. Together SMEs accounted for 42% of Canadian space sector revenues and 29% of all employees in .
Space SMEs are highly innovative. In , they accounted for 46% of all space BERD. Upstream segment space SMEs accounted for 16% of total BERD, while downstream segment SMEs accounted for 29% of total BERD in the space sector. SMEs were also responsible for 79% of inventions and 50% of registered patents in .
Space SMEs are also export-driven. In , 63% of their sales reached customers abroad. The downstream segment accounted for 78% of SMEs' export revenues, while the upstream segment accounted for 22% of SMEs' export revenues.
The SME workforce is highly skilled and specialized. In , 69% of SMEs' workforce classified as HQP (i.e. employees with at least a bachelor's degree), compared to 55% of the workforce in large firms. Similarly, 74% of SMEs' workforce were STEM employees, compared to 40% in large firms.
Universities and Research Centres
University and research centre revenues amounted to $150M in , representing 2.7% of total revenue. Universities and research centres received $139M in domestic funds, mostly from government: $112M from the federal government, $14M from provincial governments and no financial support from municipal governments. The remainder came from private foundations or companies.
In addition, universities and research centres accessed $11M in funding from foreign sources. American organizations were an important source of support for space-related activities in Canadian universities and research centres, with funds totalling $8.4M. European organizations were the second largest contributor, with funds totalling $2.4M. The remaining funding came from other regions.
Academic organizations contributed 22% of the total space sector workforce in with 2,370 FTEs, of whom 84% are HQP and 97% are STEM employees. In addition, 48% of the university and research centre workforce was comprised of students, mostly at the graduate level, who were in receipt of wages or a stipend from their university for work as research assistants, as teaching assistants, or in other employee-type arrangements.
Regarding regional distribution, universities and research centres in Ontario captured 51% of space-related funding and 50% of the workforce. Universities and research centres in the Prairies accounted for 20% of space-related funding and 20% of the workforce. Organizations in Quebec accounted for 20% of space-related funding and 18% of the workforce. B.C. captured 8% of space-related funding and 7% of the workforce. Universities and research centres in Atlantic Canada accounted for 1.1% of space-related funding and 5% of the workforce.
| Ontario | Quebec | Atlantic | British Columbia | Prairies | |
|---|---|---|---|---|---|
| Regional distribution of funding | 51% | 20% | 1% | 8% | 20% |
| Ontario | Quebec | Atlantic | British Columbia | Prairies | |
|---|---|---|---|---|---|
| Regional distribution of workforce | 50% | 18% | 5% | 7% | 20% |
Of the 42 university and research centre respondents, 10 reported coming up with inventions in and eight filed for patents. In total, Canadian universities and research centres generated 33 inventions and filed 18 patents in , accounting for 14% of space inventions and 27% of registered patents.
Universities and research centres are categorized as part of the upstream segment of the value chain, as they are mostly engaged in research and engineering. However, it is important to note that some universities and research centres also participate in downstream segment activities, such as satellite operations and the development of software and algorithms to transform space data into space-enabled solutions.
8. Conclusion
Overall, the Canadian space sector remained relatively stable in , with slight declines in revenues to $5.5B, while the workforce increased significantly to 10,541 FTEs. Export revenues remained stable this year, after stemming the growth trend over the past three years. Domestic revenues continued to decline.
BERD increased slightly in , while commercialization revenues declined to $253M. The R&D intensity for space manufacturing was 13 times higher than the average for manufacturing in Canada. The return on investment (ROI) for CSA space development programs revealed that for every $1.00 invested, companies generate $2.50 in additional follow-on revenues – a multiplier of 2.5 times.
COVID-19 has had a significant negative impact on Canadian space sector companies, affecting revenues, demand, employment, and the supply chain. The CSA will continue to monitor the health and dynamics of the Canadian space economy.

Mr. Whitehorse
This RADARSAT-2 imagery features a portrait of a man with a welcoming smile that extends the length of Crag Lake, and hair styled by Marsh Lake and the banks of Yukon River. Hugged by mountain peaks, he draws locals and tourists into Whitehorse's beautiful wilderness. () (Credits: MDA, RADARSAT-2 data © MDA [])
Annex A Economic Trends: –
| Revenues | 5,298 | 5,530 | 5,595 | 5,671 | 5,489 |
|---|
| Domestic Revenues | Export Revenues | |
|---|---|---|
| 3,704 | 1,594 | |
| 3,545 | 1,985 | |
| 3,475 | 2,120 | |
| 3,394 | 2,277 | |
| 3,180 | 2,309 |
| Year | Overall | Domestic | Domestic % | Export | Export % |
|---|---|---|---|---|---|
| $5,298,474,172 | $3,704,150,826 | 70 | $1,594,323,346 | 30 | |
| $5,530,146,153 | $3,545,430,399 | 64 | $1,984,715,754 | 36 | |
| $5,595,354,834 | $3,475,200,911 | 62 | $2,120,153,923 | 38 | |
| $5,670,589,911 | $3,393,663,363 | 60 | $2,276,926,547 | 40 | |
| $5,489,238,824 | $3,180,456,544 | 58 | $2,308,782,280 | 42 |
| Public Revenues | Private Revenues | |
|---|---|---|
| 447 | 3,257 | |
| 450 | 3,095 | |
| 405 | 3,070 | |
| 334 | 3,059 | |
| 342 | 2,839 |
| Year | Public Revenues | Private Revenues |
|---|---|---|
| $447,164,875 | $3,256,985,951 | |
| $450,307,362 | $3,095,123,037 | |
| $405,481,021 | $3,069,719,890 | |
| $334,463,454 | $3,059,199,909 | |
| $341,561,639 | $2,838,894,905 |
| United States | 854 | 918 | 984 | 1,299 | 1,289 |
|---|---|---|---|---|---|
| Europe | 354 | 470 | 512 | 451 | 437 |
| Asia | 232 | 289 | 364 | 282 | 363 |
| South America | 100 | 96 | 119 | 118 | 117 |
| Africa | 8 | 21 | 27 | 25 | 21 |
| Oceania | 14 | 34 | 19 | 24 | 16 |
| Central America, Caribbean, Mexico | 7 | 29 | 34 | 39 | 30 |
| Other | 24 | 128 | 61 | 38 | 35 |
| United States | $854,276,733 | $917,771,594 | $984,377,868 | $1,299,441,910 | $1,289,465,682 |
|---|---|---|---|---|---|
| Europe | $353,577,467 | $469,630,403 | $511,604,753 | $450,898,448 | $437,331,709 |
| Asia | $232,103,945 | $288,852,552 | $363,963,814 | $282,266,077 | $362,963,708 |
| South America | $100,393,238 | $95,673,005 | $118,768,200 | $117,568,822 | $117,005,504 |
| Africa | $8,399,427 | $21,319,454 | $26,756,979 | $25,378,752 | $21,278,947 |
| Oceania | $14,093,353 | $33,921,646 | $19,427,205 | $24,221,719 | $15,666,472 |
| Central America, Caribbean, Mexico |
$7,362,703 | $29,170,340 | $34,064,675 | $38,795,654 | $30,029,638 |
| Other | $24,116,480 | $128,376,761 | $61,190,428 | $38,355,166 | $35,040,622 |
| Satellite Commmunication | 4,461 | 4,641 | 4,735 | 4,616 | 4,563 |
|---|---|---|---|---|---|
| Navigation | 206 | 216 | 269 | 559 | 418 |
| Space Exploration | 112 | 102 | 115 | 123 | 119 |
| Earth Observation | 423 | 495 | 390 | 278 | 248 |
| Space Science | 70 | 61 | 66 | 66 | 111 |
| Other | 27 | 15 | 20 | 29 | 31 |
| Satellite Commmunication | $4,461,043,078 | $4,640,903,947 | $4,735,120,617 | $4,615,929,082 | $4,562,739,085 |
|---|---|---|---|---|---|
| Navigation | $205,643,650 | $215,513,917 | $268,991,704 | $559,109,223 | $418,054,090 |
| Space Exploration | $111,579,025 | $101,924,315 | $114,615,832 | $122,957,630 | $118,684,514 |
| Earth Observation | $422,510,765 | $495,309,241 | $390,365,118 | $277,547,875 | $247,689,131 |
| Space Science | $70,261,872 | $61,132,519 | $66,065,425 | $66,058,595 | $111,020,253 |
| Other | $27,435,783 | $15,362,216 | $20,196,138 | $28,987,504 | $31,051,651 |
| Ontario | 2,757 | 2,850 | 2,973 | 3,276 | 3,225 |
|---|---|---|---|---|---|
| Quebec | 1,667 | 1,560 | 1,528 | 1,453 | 1,302 |
| Atlantic | 335 | 468 | 472 | 415 | 431 |
| B.C. | 281 | 387 | 290 | 215 | 163 |
| Prairies | 259 | 266 | 332 | 311 | 368 |
| British Columbia | $280,517,113 | $386,996,622 | $290,382,929 | $214,914,678 | $162,646,505 |
|---|---|---|---|---|---|
| Prairies | $259,162,798 | $265,507,652 | $332,403,251 | $310,883,213 | $368,163,142 |
| Ontario | $2,757,233,517 | $2,849,572,500 | $2,972,817,122 | $3,276,098,193 | $3,224,599,935 |
| Quebec | $1,666,608,951 | $1,559,705,179 | $1,527,544,588 | $1,453,241,361 | $1,302,444,860 |
| Atlantic | $334,951,792 | $468,364,201 | $472,206,944 | $415,452,464 | $431,384,383 |
| Total Workforce | STEM | |
|---|---|---|
| 9,927.1 | 5,756.1 | |
| 9,883.1 | 5,605.3 | |
| 9,942.3 | 5,625.4 | |
| 9,566.9 | 5,794.6 | |
| 10,540.6 | 6,642.8 |
| Ontario | 4,581 | 4,407 | 4,269 | 4,047 | 4,497 |
|---|---|---|---|---|---|
| Quebec | 3,298 | 3,256 | 3,383 | 3,182 | 3,394 |
| Atlantic | 591 | 702 | 717 | 734 | 795 |
| B.C. | 590 | 624 | 569 | 638 | 739 |
| Prairies | 867 | 894 | 1,005 | 966 | 1,116 |
| Total | 9,927 | 9,883 | 9,942 | 9,567 | 10,541 |
Annex B Methodology
In this section
Questionnaire
In order to measure the changes taking place in Canada's space sector each year, the CSA uses a questionnaire to collect baseline data. Questionnaires are sent to private sector enterprises, not-for-profit organizations, research organizations and universities in Canada that engage in space activities. The questionnaire follows a census model and therefore aims to be as inclusive and exhaustive as possible.
Most organizations that responded to the questionnaire reported on a fiscal year (generally ending ), with the remainder reporting on a calendar year, from to . As in previous years, the questionnaire had a high response rate covering 208 organizations, including all major space players.
Additionally, the CSA performs quality control measures on the survey data to ensure the accuracy of the findings.
Attribution
Data are also supplemented based on CSA transfer payments (Contracts, Grants, and Contributions) in cases where this information has not been included as part of the survey responses to more fully capture revenues.
In addition, there is a limited number of cases where data are compiled from publicly disclosed reports (e.g. for publically traded companies) and verified through consultation with company officials.
Economic Trends
Prior to , the CSA made changes to the methodology, whereby significant adjustments impacted indicators for domestic revenues, Satellite Communication revenues, government vs. non-government funding, and workforce. For that reason, the economic trend analysis for this report assesses the past five years (–). For information on the economic trends prior to , readers are invited to consult previous editions of this report.
Statistics Canada Linkable File Environment
Through a linkage process, the Linkable File Environment (LFE) leverages the single-subject ability of existing surveys and administrative data to inform on business and economic issues. It positions these surveys and administrative data to support longitudinal and cross-sectional analysis and offers opportunities to use additional variables to assess entrepreneurship, employment, productivity and competitiveness.
Additional information on the LFE is available at: https://www23.statcan.gc.ca/imdb/p2SV.pl?Function=getSurvey&SDDS=6000
Economic Impact Analysis
As described in the OECD's Handbook on Measuring the Space Economy, measuring economic impacts in the space sector is a challenging task, as there is no single industrial classification for space activities. In order to overcome this difficulty, a model was developed jointly by the CSA and Innovation, Science and Economic Development Canada (ISED) to calculate the space sector's contribution to GDP (gross domestic product or value added). This process involved taking into account the various industrial classifications, weighing them and categorizing them using a value-chain approach, in order to develop a set of multipliers based on Statistics Canada's Input-Output tables. These multipliers are used to determine the impacts on GDP and employment of the space sector, the suppliers to the space sector, and the consumer spending by employees associated with both the space sector and its supply industry.
A detailed explanation of the Economic Impact Model follows:
- North American Industry Classification System (NAICS) codes were retrieved for each space company through Statistics Canada's Business Register. This exercise generated a list of 11 separate industrial classifications that covered all active Canadian space sector companies.
- Canadian space companies were categorized into a value-chain model based on the goods and services they provide: Research, Engineering and Consulting; Manufacturing; Satellite Operations; Service Providers; and Broadcasting Services.
- Universities, research centres and associations were grouped together under Research, Engineering and Consulting, as in most cases their space sector activities are related to R&D.
- The grouping of NAICS codes in each of the value-chain categories were then weighted for their relative importance within that particular category. Weighting was established on the basis of workforce tied to each NAICS code. The more workforce associated with organizations in a particular NAICS code, the heavier that NAICS code was weighted relative to the grouping of NAICS codes in that value-chain category.
- Customized economic multipliers were then built for each value-chain category based on Statistics Canada's input-output accounts for existing NAICS codes. These multipliers are at three levels: space sector, supply industry and consumer spending by associated employees.
- Employment levels for each value-chain segment of the space sector (collected directly from companies through the questionnaire) are entered in the Economic Impact Model. The customized economic multipliers are then applied to generate the space sector's total GDP and workforce impact numbers.
The "multiplier effect
" refers to the total impacts (space sector, supply industry and consumer spending by associated employees) divided by the initial space sector impact. This gives the reader an idea of the impact that one job or one dollar in the space sector has on the wider economy.
Note: Two types of primary inputs can be used in an input-output model: revenues or employment. Employment has been chosen here, as it provides a more accurate portrait of the true level of economic activity being performed within Canada's borders. The results of this analysis can be considered a conservative estimate of Canada's space sector impact, particularly when compared to third-party studies or comparative international reports, which may use different methodologies.
Return on Investment
Return on Investment (ROI) is defined as the ratio rate of return between net income and investment.
For the past three years the CSA has been surveying companies to determine the return on investment (ROI) from CSA space development programs. The process involved asking a series of questions related to reputation effects, intent to generate revenues, and revenues generated for each project supported by space development programs.
Highly Qualified Personnel and STEM Workforce
Highly qualified personnel (HQP) is defined as the number of space-related employees who have at least a bachelor's degree. This definition aligns with Statistics Canada's definition of HQP, enabling comparisons with other sectors of the economy.
STEM employees are space-related employees involved in science, technology, engineering or mathematics activities. For the purpose of this survey, STEM employees include engineers, scientists, technicians, management, health professionals and students working in the space sector. Management employees are included in the STEM indicator because the vast majority of employees in this category are managing STEM-related activities. Similarly, students were included in this indicator, because the vast majority of students employed by space companies are directly involved in STEM activities. This approach aligns more closely with Statistics Canada's and the OECD's definitions of STEM employees.
Annex C Definitions
In this section
Canada's Space Sector
The Canadian space sector is defined as organizations (private, public and academic) whose activities include the development and use of space assets and/or space data.
Space Value-Chain Categories
This report uses a methodology developed by the Organisation for Economic Co-operation and Development's Space Forum, of which the CSA is a Steering Committee member, to characterize Canadian space activities on the basis of a value-chain approach. The definitions of space sector categories were updated in the edition of this report as per the value-chain approach, with findings presented on the basis of upstream and downstream segment activities. This re-categorization is intended to improve the measurement of the space sector and enable international comparisons.
Under this value-chain approach, data have been organized into categories that align with the stages of producing space goods and services: Research, Engineering and Consulting; Space Segment Manufacturing; Ground Segment Manufacturing; Satellite Operations; Products and Applications; and Services. This approach replaces the space categories used in the annual State of the Canadian Space Sector Reports from to .
Upstream Segment
The upstream segment refers to the effort required to design, test, build, integrate, and launchFootnote 2 assets into space.
- Research, Engineering and Consulting: Research and development (R&D) related to non-commercial or pre-commercial activities; applied science; design and testing of spacecraft, satellites and payloads or components thereof; support services directed at enabling other space sector actors throughout the value chain, including outreach activities, legal services, insurance provision, market research, policy and management services.
- Space Segment Manufacturing: Building and integration of spacecraft, satellites, payloads or any component thereof.
- Ground Segment Manufacturing: Building and integration of facilities and equipment on Earth for satellite operations, often known as "
ground stations.
"
Downstream Segment
The downstream segment refers to the effort required for the day-to-day operation of space assets, manufacturing of products and software applications that transform space data and signals into useful end products, and services provided to end-users.
- Satellite Operations: Day-to-day management of satellites and spacecraft once they are in space, e.g. telemetry, tracking and command; monitoring, recovery operations and collision avoidance; mission planning for satellite passes; uplinks and downlinks for signal processing to reception facility; lease or sale of satellite capacity.
- Products and Applications: Manufacturing/development of software or hardware that enable the transformation of space-derived resources into a usable/useful format, e.g. computer software applications, chipsets, Very Small Aperture Terminals and other terminals, antennas, satellite phones, video and audio receivers-decoders, and GPS devices. This category also includes publishing digital or print books, atlases and maps using space-based data.
- Services: Provision of services which are dependent on space-based signals or data to various end-users (individual consumers, government departments, or businesses), e.g. subscriptions to satellite radio, phone, television or Internet services; engineering, architectural and environmental consulting based on the processing and analysis of Positioning, Navigation and Timing (PNT) or Earth Observation (EO) data; support services provided to users of space-based products and applications, such as provision of computer consulting and facilities management, data processing, Web hosting and portals, and streaming services.
Sectors of Activity
The activities of space organizations can also be broken down, as has been done in previous reports, according to the ultimate use or purpose of the research carried out or the goods and services produced. Space sector activities can serve commercial, civil or military purposes, and refer to activities across the value chain:
- Navigation: The development and use of satellites for localization, positioning and timing services. Navigation is used for air, maritime and land transport, or the localization of individuals and vehicles. It also provides a universal referential time and location standard for a number of systems.
- Satellite Communication: The development and use of satellites to send signals to Earth for the purpose of fixed or mobile telecommunications services (voice, data, Internet, and multimedia) and broadcasting (TV and radio services, video services, Internet content).
- Earth Observation (EO): The development and use of satellites to measure and monitor Earth (including its climate, environment and people) for a number of purposes such as resource management, mineral exploration, disaster assessment, security and defence.
- Space Exploration: The development and use of crewed and uncrewed spacecraft (space stations, rovers and probes) to investigate the reaches of the universe beyond Earth's atmosphere (e.g. the Moon, other planets, asteroids). The International Space Station and astronaut-related activities are considered in this sector.
- Space Science: The various science fields that relate to space flight or any phenomena occurring in space or on other planets (e.g. astrophysics, planetary science, space-related life science).
- Other: Generic technologies or components that are not destined for use on a specific space system or for a specific space application. This could be the case for early-phase research, small off-the-shelf components used in various systems, or services based on integrated applications.
Canadian Space Agency
John H. Chapman Space Centre
6767 Route de l'Aéroport,
Saint-Hubert, Quebec J3Y 8Y9
Canada
www.asc-csa.gc.ca