
State of the Canadian Space Sector Report
ISSN: 2369-6338
Table of Contents
About this Report
Objective
The State of the Canadian Space Sector Report provides factual information about features of the Canadian space sector. The Report has been published since based on a questionnaire sent to organizations involved in space activities across Canada, including companies, not-for-profit organizations, research centres and universities. This year's report is based on data from 160 organizations.
The baseline data in the Report include the number of organizations active in the sector and their composition (e.g. share of small and medium-sized enterprises (SMEs), share of universities), the sectors of activity (Satellite Communication, Earth Observation, Space Exploration, Science, and Navigation), the Canadian space workforce and composition (e.g. share of highly qualified personnel (HQP), regional distribution, and types of jobs), research and development (R&D) and innovation. In this edition, data are reported for the – period. Readers should consult previous editions (available on the Canadian Space Agency website) for information regarding results prior to .
The organization-specific information used to compile this report remains strictly confidential and will not be released in any manner other than aggregate form. Consequently, in certain circumstances, a detailed explanation or in-depth reporting of the results cannot be provided in order to protect the confidentiality of the respondents.
About the Authors
Policy Branch
This report is produced by the Economic Analysis and Research Team, Policy Branch, at the Canadian Space Agency.
Contact
David Haight, Chief Economist, david.haight@canada.ca
Renée St-Amant, Senior Economist, renee.st-amant@canada.ca
Please send media inquiries to CSA Communications, 450-926-4370, ASC.Medias-Media.CSA@canada.ca.
For More Information
For more information about the Canadian space sector, or for an electronic copy of this report, please go to www.asc-csa.gc.ca/eng/publications.
Acknowledgments
The CSA wishes to acknowledge all those who responded to the questionnaire. Without them, this report would not have been possible.
President's Message

I am honoured to present the State of the Canadian Space Sector Report, covering the results from our survey. This report provides comprehensive information on the economic activity generated in the Canadian space sector and highlights the impact of space investments on the economy. It is based on information gathered from over 160 organizations involved in space activities from across Canada, including small businesses, multinational space companies, not-for-profit organizations, research centres and universities.
The annual State of the Canadian Space Sector Report, which we have been publishing since , is the primary reference on the Canadian space sector. It contributes to our understanding of the sector by providing reliable and authoritative data, as well as long-term trend analysis.
In , the space sector achieved revenues of $5.3B with a workforce of nearly 10,000. Upstream segment activities related to research, engineering and manufacturing accounted for $0.9B, while downstream segment operations, products and services accounted for $4.4B. Domestic revenues decreased from to , however exports increased year-over-year. Overall, the space sector contributes $2.7B to Canada's GDP and supports over 24,000 jobs in the greater national economy.
The space sector is highly innovative and generates products and services that benefit Canadians every day. The survey results show that Business Expenditures on Research and Development (BERD) and the sector's overall R&D intensity were higher than ever, with investments of $256M in R&D. The academic sector also continued to be an important part of the space sector, representing nearly 20% of the workforce and six of the sector's top thirty space organizations in terms of space-related revenues or research funding.
I trust you will find this publication useful. I would like to thank all those who contributed to the survey, which made this publication possible.
Executive Summary
In , total revenues in the Canadian space sector totalled $5.3B, representing a slight decrease overall of 1.6%, or $85M, year-over-year.
The average annual growth rate Footnote 1 of the space sector over the last five years (–) is relatively flat at 0.4%.
Domestic revenues decreased by 3% year-over-year, or $122.3M, totalling $3.7B in . Non-government sources of revenue, at 88%, continued to make up the majority of domestic revenues. The remaining 12% of domestic revenues were derived from Canadian governments (federal, provincial and municipal), most of which is federal funding, notably from the Canadian Space Agency, the Natural Sciences and Engineering Research Council, and the Department of National Defence.
Export revenues in increased by 2%, or $37.7M, totalling $1.6B. Export revenues increased in all regions except Quebec and the Atlantic region, where exports have declined for a second year. Ontario organizations accounted for 57% of Canadian space exports, followed by Quebec with 14%. Non-government customers are the most important market segment abroad, accounting for 84% of upstream segment revenues and 95% of downstream segment revenues.
Defence-related revenues remained stable from $152M in to $151M in . Defence-related revenues continue to be export driven with $103M in exports and $48M derived from domestic customers.
Workforce totalled 9,927 space-related full-time equivalents (FTEs) in , of which 43% are highly qualified personnel (HQP).
Overall, workforce is relatively evenly divided between the upstream and downstream segment organizations with 53% and 47% of the total workforce, respectively. HQP is an important indicator which differentiates the profile of the workforce. In the upstream segment, 59% of the workforce are HQP, while in the downstream segment, 25% of workforce are HQP.
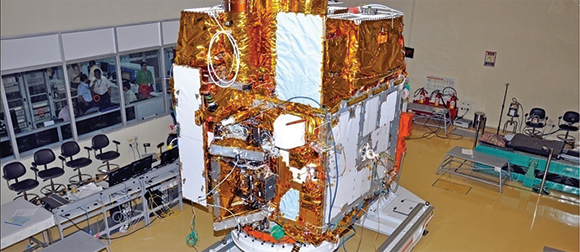
The ASTROSAT satellite, an Indian astronomy satellite with Canadian instruments aboard, was successfully launched by the Indian Space Research Organisation. The Canadian contribution, an imaging instrument known as UVIT, entitles Canadian scientists to observation time on the satellite, which means opportunities for unique astronomy research () (Credit: Indian Space Research Organisation [ISRO])

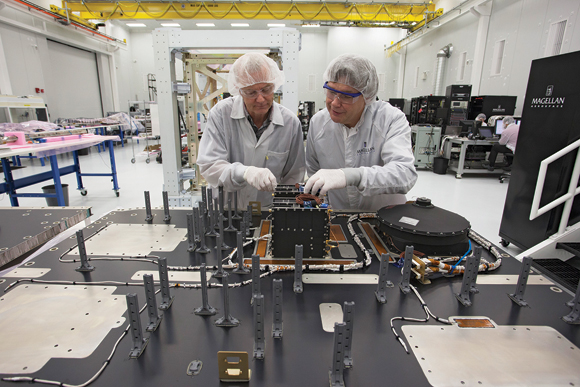
Two Canadian science projects were launched to the International Space Station (ISS) aboard a Cygnus re-supply craft. MARROW studies the mechanisms behind the effects of immobility, while Vascular Echo examines the mechanisms that underpin accelerated arterial stiffening in astronauts. Both projects will likely help maintain astronauts' health and improve health and quality of life here on Earth (). (Credit: Magellan Aerospace)
Academic organizations contribute 20% of the total space sector workforce with 1,997 full-time equivalents, of which 55% are highly qualified personnel (HQP) such as engineers, scientists and technicians. Of the 36 university and research centre respondents, 10 reported having made at least one space-related invention in , five of which filed for one or more patents.
In terms of sectors of activity, revenue growth occurred in Navigation, Space Science and General Technologies in . Decreased revenues occurred in Satellite Communication, Space Exploration and Earth Observation.
The upstream segment accounted for $0.9B in revenues. Revenues derived strictly from manufacturing activities (a subset of the upstream segment) totalled $667M, representing a 32% decline over results. The downstream segment accounted for the majority of revenues at $4.4B in . Of note, broadcasting services revenues were $2.56B in , representing a 58% share of the downstream segment.
In , the top 30 Canadian space organizations generated 98% of total space revenues and 84% of space employment, a pattern consistent with previous years despite changes in the composition and rank of the top 30 space organizations.
Ninety-three percent of all Canadian space companies are SMEs, 63% of which are upstream segment companies and 37% are downstream segment companies. Together, SMEs account for 39% of Canadian space sector revenues and 26% of all employees.
Research and development (R&D) expenditures totalled $256M in , with 67 organizations undertaking space R&D projects. This represents a significant increase over results, with R&D expenditures up by $110M. Upstream segment organizations were more R&D intensive, spending 55% of total space sector business expenditures on research and development (BERD). Upstream and downstream segments have similar rates of invention and patenting activity, both with 38% of organizations claiming inventions in the past year and 20% and 21%, respectively, filing for patents.
In , the space sector is estimated to have contributed $2.7B to Canada's GDP and supported a total of 24,217 jobs in Canada's greater economy.
Methodology
Questionnaire
In order to measure the changes taking place in Canada's space sector each year, the CSA uses a questionnaire to collect baseline data. Questionnaires are sent to private sector enterprises, not-for-profit organizations, research organizations and universities in Canada that engage in space activities. The questionnaire follows a census model and therefore aims to be as inclusive and exhaustive as possible.
Most organizations that responded to the questionnaire reported on a calendar year from to , with the remainder reporting on a fiscal year, generally ending . As in previous years, the questionnaire had a high response rate covering 160 organizations, including all major space players.
Additionally, the CSA performs quality control measures on the survey data to ensure the accuracy of the findings.
Attribution
Data are also added based on CSA transfer payments (Contracts, Grants, and Contributions) in cases where this information has not been included as part of the survey responses.
In addition, there are a limited number of cases where data are compiled from publicly disclosed reports (e.g. for publically traded companies) and verified through consultation with company officials.
Indexing
Due to changes in methodology in the edition of this report, whereby downstream segment organizations were added to the survey population, space sector revenues have grown significantly in the trend analysis. Specifically, indicators were impacted for domestic revenues, Satellite Communication revenues, government vs. non-government funding, Ontario and Quebec revenues, and workforce. For that reason, to ensure statistically relevant findings that account for methodological changes when presenting the average annual growth rate or other historical growth trends, results have been indexed to a base year (). This allows the reader to compare results over the last 5 or 10 years using a common baseline. In other words, the baseline index deflates survey results of the past two years ( and ) to account for methodological changes. Any and all results which have been calculated using the index are noted throughout the text.
Economic Impact Analysis
As described in the OECD's Handbook on Measuring the Space Economy, measuring economic impacts in the space sector is a challenging task, as there is no single industrial classification for space activities. In order to overcome this difficulty, a model was developed jointly by the CSA and Innovation, Science and Economic Development Canada (ISED) to calculate the space sector's contribution to gross domestic product (GDP) or value added. This process involved taking into account the various industrial classifications, weighing them and categorizing them using a value-chain approach, in order to develop a set of multipliers based on Statistics Canada's Input-Output tables. These multipliers are used to determine the impacts on GDP and employment of the space sector, the suppliers to the space sector, and the consumer spending by employees associated with both the space sector and its supply industry.
A detailed explanation of the Economic Impact Model follows:
- North American Industry Classification System (NAICS) codes were retrieved for each space company through Statistics Canada's Business Register. This exercise generated a list of nine separate industrial classifications that covered all active Canadian space sector companies.
- Canadian space companies were categorized into a value-chain model based on the goods and services they provide: Research, Engineering and Consulting Services; Manufacturing; Satellite Operations; Value-added Service Providers; and Broadcasting Services.
- Universities, research centres and associations were grouped together under Research, Engineering and Consulting, as in most cases their space sector activities are related to R&D.
- The grouping of NAICS codes in each of the value-chain categories were then weighted for their relative importance within that particular category. Weighting was established on the basis of workforce tied to each NAICS code. The more workforce associated with organizations in a particular NAICS code, the heavier that NAICS code was weighted relative to the grouping of NAICS codes in that value-chain category.
- Customized economic multipliers were then built for each value-chain category based on Statistics Canada's input-output accounts for existing NAICS codes. These multipliers are at three levels: space sector, supply industry and consumer spending by associated employees.
- The multipliers were adjusted to account for supply-chain linkages within the space sector itself, as multiple companies supply each other with intermediate goods and services which would otherwise lead to an overestimation of the sector's impact.
- Employment levels for each value-chain segment of the space sector (collected directly from companies through the questionnaire) are entered in the Economic Impact Model. The customized economic multipliers are then applied to generate the space sector's total GDP and workforce impact numbers.
The "multiplier effect"
refers to the total impacts (space sector, supply industry and consumer spending by associated employees) divided by the initial space sector impact. This gives the reader an idea of the impact that one job or one dollar in the space sector has on the wider economy.
Note: Two types of primary inputs can be used in an input-output model: revenues or employment. Employment has been chosen here as it provides a more accurate portrait of the true level of economic activity being performed within Canada's borders. The results of this analysis can be considered a conservative estimate of Canada's space sector impact, particularly when compared to third-party studies or comparative international reports, which may use different methodologies.
Definition of Canada's Space Sector
The Canadian space sector is defined as organizations (private, public and academic) whose activities include the development and use of space assets and/or space data.
Definition of Space Value-Chain Categories
This report uses a methodology developed by the Organisation for Economic Co-operation and Development's Space Forum, of which the CSA is a Steering Committee member, to characterize Canadian space activities on the basis of a value-chain approach. The definitions of space sector categories were updated in the edition of this report as per the value-chain approach, with findings presented on the basis of upstream and downstream segment activities. This re-categorization is intended to improve the measurement of the space sector and enable international comparisons.
Under this value-chain approach, data have been organized into categories that align with the stages of producing space goods and services: Research, Engineering and Consulting; Space Segment Manufacturing; Ground Segment Manufacturing; Satellite Operations; Products and Applications; and Services. This approach replaces the space categories used in the annual State of the Canadian Space Sector Reports from –.
Note: Data and trend analysis are reported using the new methodology unless specifically stated otherwise. Any results that have been impacted by methodological changes have been identified in this report.
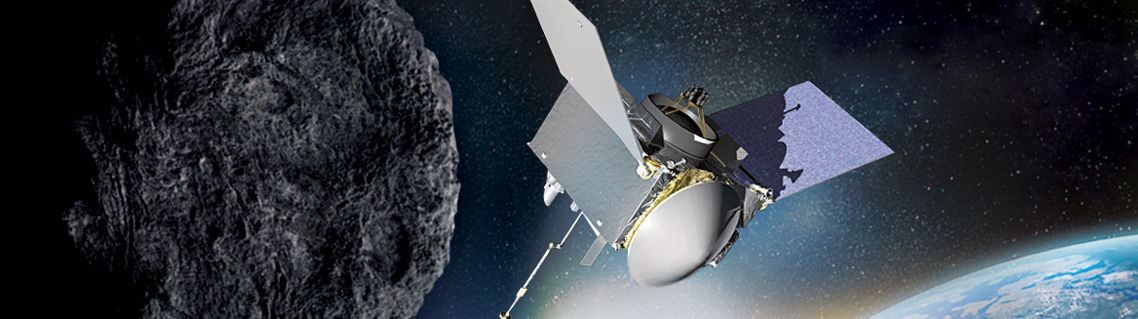
The Canadian Space Agency contributed a sophisticated laser-based mapping system, known as the OSIRIS-REx Laser Altimeter (OLA), to NASA's OSIRIS-REx mission, which will study asteroid Bennu and attempt to bring a sample of it to Earth (). (Credit: CSA)

The Government of Canada announced an additional $2.6M in funding towards Canada's contribution to the James Webb Space Telescope, the most powerful telescope ever built. Canada is contributing the Fine Guidance Sensor (FGS) and the Near-Infrared Imager and Slitless Spectrograph (NIRISS). This contribution guarantees Canadian astronomers a share of observing time on the telescope (). (Credit: CSA)
Upstream Segment
The upstream segment refers to the effort required to design, test, build, integrate, and launch Footnote 2 assets into space.
- Research, Engineering, Testing and Consulting: Research and development (R&D) related to non-commercial or pre-commercial activities; applied science; design and testing of spacecraft, satellites and payloads or components thereof; support services directed at enabling other space sector actors throughout the value chain, including outreach activities, legal services, insurance provision, market research, policy and management services.
- Manufacturing: Building and integration of spacecraft, satellites, payloads or any component thereof. Building and integration of facilities and equipment on Earth for satellite operations, often known as
"ground stations."
Downstream Segment
The downstream segment refers to the effort required for the day-to-day operation of space assets, manufacturing of products and software applications that transform space data and signals into useful end products, and services provided to end-users.
- Satellite Operations: Day-to-day management of satellites and spacecraft once they are in space, e.g. telemetry, tracking and command; monitoring, recovery operations and collision avoidance; mission planning for satellite passes; uplinks and downlinks for signal processing to reception facility; lease or sale of satellite capacity.
- Products and Applications: Manufacturing/development of software or hardware that enable the transformation of space-derived resources into a usable/useful format, e.g. computer software applications, chipsets, Very Small Aperture Terminals and other terminals, antennas, satellite phones, video and audio receivers-decoders, and GPS devices. This category also includes publishing digital or print books, atlases and maps using space-based data.
- Services: Provision of services which are dependent on space-based signals or data to various end-users (individual consumers, government departments, or businesses), e.g. subscriptions to satellite radio, phone, television or Internet services; engineering, architectural and environmental consulting based on the processing and analysis of Positioning, Navigation and Timing (PNT) or Earth Observation (EO) data; support services provided to users of space-based products and applications, such as provision of computer consulting and facilities management, data processing, Web hosting and portals, and streaming services.
Magellan Aerospace and the University of Manitoba opened their joint Advanced Satellite Integration Facility in Winnipeg, a 560 square metre (6,000 square foot) facility capable of integrating up to three satellites at one time. The facility was funded by Magellan and Western Economic Diversification. (Credit: Magellan Aerospace)
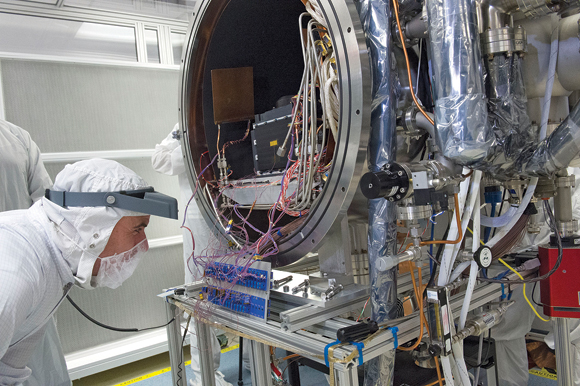
OLA undergoes a final visual inspection before being sealed in a chamber for thermal-vacuum testing to determine whether the instrument can withstand the harsh environment of space. (Credit: NASA / Goddard / Debora McCallum)
Definition of Sectors of Activity
The activities of space organizations can also be broken down, as has been done in previous reports, according to the ultimate use or purpose of the research carried out or the goods and services produced. Space sector activities can serve commercial, civil or military purposes, and refer to activities across the value chain:
- Navigation: The development and use of satellites for localization, positioning and timing services. Navigation is used for air, maritime and land transport, or the localization of individuals and vehicles. It also provides a universal referential time and location standard for a number of systems.
- Satellite Communication: The development and use of satellites to send signals to Earth for the purpose of fixed or mobile telecommunications services (voice, data, Internet, and multimedia) and broadcasting (TV and radio services, video services, Internet content).
- Earth Observation (EO): The development and use of satellites to measure and monitor the Earth (including its climate, environment and people) for a number of purposes such as resource management, mineral exploration, disaster assessment, security and defence.
- Space Exploration: The development and use of manned and unmanned spacecraft (space stations, rovers and probes) to investigate the reaches of the universe beyond Earth's atmosphere (e.g. the Moon, other planets, asteroids). The International Space Station and astronaut-related activities are considered in this sector.
- Space Science: The various science fields that relate to space flight or any phenomena occurring in space or on other planets (e.g. astrophysics, planetary science, space-related life science).
- Other: Generic technologies or components that are not destined for use on a specific space system or for a specific space application. This could be the case for early phase research, small off-the-shelf components used in various systems, or services based on integrated applications.
Overall Results
Total Revenues
In , total revenues in the Canadian space sector totalled $5.3B, representing a slight decrease overall of 1.6%, or $85M, year-over-year. The average annual growth rate of the space sector over the last five years (–) is relatively flat at 0.4%. Footnote 3 A detailed analysis of the source of this growth can be found in the Markets section of this report.
| Revenues | 137.67 | 139.45 | 133.20 | 139.62 | 142.61 | 140.37 |
|---|
Note *To account for methodological changes to the survey in 2014 and enable consistency in data presentation, indexed values are calculated based on the year-over-year growth rate.
Revenues of Canada's Leading Space Organizations
In , the top 30 Canadian space organizations generated 98% of total space revenues and 84% of space employment, a pattern consistent with previous years despite changes in the composition and rank of the top 30 space organizations. Most of the top 30 organizations are companies; however, several academic organizations are also represented. Fourteen of the top 30 are downstream segment companies.
By comparison, the top 10 organizations accounted for 91% of total space revenues and 65% of employment. Revenue and workforce concentration in the top 10 organizations is virtually the same as last year, when those organizations accounted for 90% of revenues and 65% of workforce. Seven of the top 10 are downstream segment companies.
Large companies, classified as having 500 employees or more, are rare in the space sector. Only 7% of the company survey population were classified as large enterprises.
Seventy-two organizations reported space revenues in excess of $1M during , ten more than in .
Small and Medium-Sized Enterprises (SMEs)
Ninety-three percent of Canadian space companies are SMEs, and indeed many of Canada's top space companies are SMEs (defined as employing 1 to 499 workers). SMEs are concentrated most heavily in research, engineering and consulting activities in the upstream segment and in the production of value-added products, applications and services in the downstream segment: 63% of SMEs in the space sector survey population are upstream segment companies, while 37% are downstream segment companies. Together SMEs account for 39% of Canadian space sector revenues and 26% of all employees.
Space SMEs are highly innovative, corresponding to 61% of all space business expenditures on R&D (BERD), and export-driven with 57% of SME sales reaching customers abroad. Upstream segment space SMEs are responsible for 17% of total BERD, while downstream segment SMEs account for 44% of total BERD in the space sector. The Downstream segment is significantly more export oriented, accounting for 87% of SMEs revenues from clients abroad, compared to 13% in the upstream segment.
The SME workforce is highly skilled and specialized with 56% of its workforce classified as HQP (compared to 32% of the workforce in large firms).
Universities and Research Centres
University and research centre revenues amounted to $125M in , representing 2.4% of total revenue, with six universities making it into Canada's top 30 space organizations. Universities and research centres received $115.6M in domestic funds, mostly from government: $91.6M from the federal government and $14.7M from provincial governments. The remainder came from private foundations or companies.
In addition, universities and research centres continued to access foreign sources of funding, totalling $9M. American organizations were an important source of support for space-related activities in Canadian universities and research centres, with funds totalling $2.8M. Nearly as much funding, $2.4M, came from European sources. The remaining funding came from other world regions.
Academic organizations contribute 20% of the total space sector workforce with 1,997 full-time equivalents, of which 55% are highly qualified personnel (HQP) such as engineers, scientists and technicians. An additional 40% of the university and research centre workforce is comprised of students, mostly at the graduate level, who are in receipt of wages or a stipend from their university for work as research assistants, teaching assistants, or other employee-type situations.
Regarding regional distribution, Ontario organizations capture 44% of space-related funding in this category and 47% of the workforce. Quebec and the Prairies account for similar amounts of space-related funding, 22% and 28% respectively, and workforce, 23% and 20% respectively, at universities and research centres. B.C. and Atlantic regions are also at similar rates of space research funding and workforce, capturing 3% each of funding and 5% and 4% of workforce, respectively. The pie charts below illustrate the regional distribution trends.
| Ontario | Quebec | Prairies | Atlantic | British Columbia | |
|---|---|---|---|---|---|
| Regional distribution of funding | 44% | 22% | 28% | 3% | 3% |
| Ontario | Quebec | Prairies | Atlantic | British Columbia | |
|---|---|---|---|---|---|
| Regional distribution of workforce | 47% | 23% | 20% | 4% | 5% |
Of the 36 university and research centre respondents, 10 reported coming up with at least one space-related invention in , five of which filed for one or more patents.
For the purposes of this report, funding for space-related activities performed at universities and research centres is consolidated with company revenues and reported as total space sector revenues for the year, which is $5.3B in . Because of the general nature of activities undertaken at universities and research centres, these organizations are categorized as part of the upstream segment of the value chain. It is important to note, however, that while universities and research centres are mostly engaged in research and engineering, some also participate in downstream segment activities, such as satellite operations and the development of software and algorithms to transform space data into space solutions.
Regional Distribution and Trends
While the proportional share of total revenues by region has remained relatively stable from year to year, the inclusion of new downstream segment space sector firms in the previous edition of this report () resulted in a shift in regional distribution in favour of Quebec. This impacts the five-year trend analysis only and not the changes reported year-over-year from to .
| Ontario | Quebec | Atlantique | British Columbia | Prairies | |
|---|---|---|---|---|---|
| 52% | 32% | 6% | 5% | 5% |
| Export | Domestic | Export | Domestic | |
|---|---|---|---|---|
| B.C. | 83 | 226 | 106 | 174 |
| Prairies | 167 | 101 | 192 | 68 |
| Ontario | 913 | 1,792 | 916 | 1,841 |
| Quebec | 238 | 1,559 | 225 | 1,442 |
| Atlantic | 156 | 148 | 156 | 179 |
| British Columbia | Prairies | Ontario | Quebec | Atlantic | |
|---|---|---|---|---|---|
| Percentage change | 59% | -6% | 5% | -3% | -15% |
British Columbia
In , British Columbia had revenues of $281M, representing a decrease of 9% ($28M) over revenues. Domestic revenues decreased by 23%, or $52M, from $226M in to $174M in ; export revenues increased by 29%, from $83M in to $106M in .
Between and , B.C.'s total revenues increased by 59%, from $177M to $281M. This growth has been driven by domestic revenue sources, which have increased from $81M to $174M, while export revenues increased slightly from $95M to $106M, over the same period.
Five percent of Canadian space sector revenues can be attributed to B.C., where the number of upstream and downstream segment respondents is approximately equal. Contrary to other regions, upstream segment organizations tend to generate more revenues (74%) than downstream segment organizations (26% of revenues).
Prairies (Alberta, Saskatchewan and Manitoba)
Revenues in the Prairies decreased by 3%, or $9M, over last year, settling at $259M in . Domestic revenues decreased by 33%, or $34M, from $101M in to $68M in ; export revenues increased by 15%, from $167M in to $192M in .
- Alberta revenues increased by 19%, or $27M, from $142M to $169M;
- Saskatchewan revenues decreased by 6%, or $4M, from $63M to $59M;
- Manitoba revenues returned to levels, decreasing by $32M and totalling $31M.
Over the past five years, total revenues in the region have decreased by 6%. Revenues totalled $275M in compared to $259M in . Domestic revenues declined from $89M in to $68M in , while exports grew slightly from $186M to $192M in the same period.
Five percent of Canadian space sector revenues can be attributed to the Prairies. Revenues are fairly evenly split with 47% in the upstream segment and 53% in the downstream segment.
Ontario
Revenues in Ontario increased by 2%, or $52M, over last year and reached $2.8B in . Domestic revenues increased by 3%, or $49M, from $1.79B in to $1.84B in ; export revenues remained flat with 0.3% growth, from $913M in to $916M in .
Total revenues in Ontario have grown by 5% over the past five years, with domestic revenues increasing by 8%. Footnote 4 Exports, which were not impacted by methodological changes in the edition of this report, have increased by 0.4% ($913M to $916M).
Fifty-two percent of Canadian space sector revenues can be attributed to Ontario, declining from 68% in . This decline vis-à-vis other provinces is a result of a slower growth rate than other regions and also a reflection of changes to the methodology in , which added significant revenues from broadcasting to the Quebec region, shifting the portrait of regional distribution.
There are more than twice as many upstream segment organizations as downstream segment organizations represented in the survey for the Ontario region. However, downstream segment organizations account for 88% of revenues in the province due to significant revenue in Satellite Operations, manufacturing of Satellite Communication hardware, and broadcasting services. Upstream organizations account for the remaining 12% of revenues.
Quebec
Revenues in Quebec decreased by 7%, or $130M, over last year, settling at $1.67B in . Domestic revenues decreased by 7.5%, or $117M, from $1.56B in to $1.44B in ; exports decreased by 5.5%, from $238M in to $225M in .
Over the past five years, domestic revenues in Quebec have increased significantly due to the addition of new downstream companies in the survey population. However, using the indexed values to account for methodological changes, total revenues in Quebec have declined by 3% over the last five years, with domestic revenues in Quebec having decreased by 41%. Footnote 5 Exports, which were not impacted by methodological changes in the edition of this report, have increased by 11% over the last five years, from $202M in to $225M in .
One-third (32%) of Canadian space sector revenues can be attributed to Quebec. Quebec's profile is similar to Ontario's in that there are twice as many upstream segment organizations as downstream segment organizations, while revenues are heavily concentrated in the downstream segment (87%) rather than the upstream (13%).
Atlantic Canada (New Brunswick, Newfoundland, Nova Scotia and PEI)
In , the Atlantic region saw revenues increase by 10%, or $31M, over last year. Domestic revenues drove growth, increasing by $31M (from $148M to $179M), while exports were stable at $156M from to .
- As with the last two years, revenues in New Brunswick accounted for the domestic revenue growth in the region, with growth of 24% year-over-year and total revenues of $150M.
- Revenues in Newfoundland decreased slightly, by 1%, settling at $177M.
- Revenues in Nova Scotia increased by 38%, reaching $9M.
Looking at the five-year trend analysis, total revenues in the Atlantic region have decreased by 15%, or $58M. While domestic revenues have doubled from $86M in to $179M in , exports have been dragging down overall revenue growth. Exports decreased by 49%, or $151M, during the same five-year period.
Six percent of Canadian space sector revenues can be attributed to the Atlantic region. In Atlantic Canada, there are a few small to medium-sized upstream segment players, which are mainly academic, and a handful of downstream segment organizations. Downstream segment organizations account for 95% of revenues and upstream segment organizations the remaining 5%.
Markets
Market Share by Value-Chain Category
Revenues accruing to space organizations can be broken down into value-chain categories. The categories relate to the type of work that the organization is carrying out in order to produce goods and services and are broadly divided into upstream and downstream segment activities. The upstream segment in Canada—comprised of R&D, engineering, consulting, space and ground segment manufacturing—was worth roughly $0.9B in . The downstream segment—comprised of satellite operations, manufacturing of products (e.g. terminals), development of software applications, and the provision of services (e.g. broadcasting)—was worth $4.4B in . A detailed description of the value-chain categorization is provided in the Methodology section of this report. A breakdown of revenues in each category is as follows:
- Research, Engineering and Consulting amounted to $205M in and account for 4% of total revenues.
- Ground Segment Manufacturing amounted to $126M in and accounts for 2% of total revenues.
- Space Segment Manufacturing amounted to $541M in and accounts for 10% of total revenues.
- Satellite Operations amounted to $985M in and account for 19% of total revenues.
- Products and Applications amounted to $624M in and account for 12% of total revenues.
- Services amounted to $2.8B in and account for 53% of total revenues.
| Satellite Operations | Value-Added Products and Applications | Services | Ground Segment Manufacturing | Space Segment Manufacturing | Research, Engineering and Consulting | |
|---|---|---|---|---|---|---|
| 18.6% | 11.8% | 53.2% | 2.4% | 10.2% | 3.9% |
Market Share by Sector of Activity
In terms of sectors of activity, revenue growth occurred in Navigation, Space Science and General Technologies in . Decreased revenues were felt in Satellite Communication, Space Exploration and Earth Observation. Trends for the – period are detailed below using Compound Annual Growth Rate (CAGR). As with findings presented throughout this report, the breakdown is provided at current market prices, in other words unadjusted for inflation.
Note that methodological changes have had an impact on the five-year trend analysis for the Satellite Communication sector; however, other sectors of activity remain unaffected.
| Satellite Communications |
Earth Observation |
Navigation (GPS) | Space Exploration |
Space Science |
Other | |
|---|---|---|---|---|---|---|
| Percentage change | -3% | 65% | -21% | 5% | 14% | 10% |
| Satellite Communication | Earth Observation | Navigation (GPS) | Space Exploration | Space Science | Other | |
|---|---|---|---|---|---|---|
| 84.2% | 8.0% | 3.9% | 2.1% | 1.3% | 0.5% |
Satellite Communication
Satellite Communication revenues were stable year-over-year, with a slight decrease of 1%, or $42M, from to , and account for 84% of total space revenues.
Of the $4.5B in Satellite Communication revenues, the vast majority (91%) was derived from activities in the downstream segment, broken down as follows:
- Satellite Operations: $977M
- Applications and Products (e.g. antennas): $354M
- Broadcasting Services: $2.56B
- All other telecommunication services: $190M
The remainder of Satellite Communication revenues was related to upstream segment activities:
- Research, Engineering and Consulting: $36M
- Space Segment Manufacturing: $256M
- Ground Segment Manufacturing: $84M
Satellite Communication revenues have decreased by 3% over the last five years (–). This represents an average annual growth rate of -0.5%. Footnote 6
| Ground Segment Manufacturing | Research, Engineering and Consulting | Satellite Operations | Services | Value-Added Products and Applications | Space Segment Manufacturing | |
|---|---|---|---|---|---|---|
| 1.9% | 0.8% | 21.9% | 61.7% | 7.9% | 5.7% |
Earth Observation (EO)
EO revenues decreased by 18%, or $93M, from to , and account for 8% of total space revenues.
The majority of revenues were in the upstream segment:
- Research, Engineering and Consulting: $43M
- Space Segment Manufacturing: $215M
- Ground Segment Manufacturing: $38M
The remainder of revenues was related to activities in the downstream segment:
- Satellite Operations: $6M
- Applications and Products: $43M
- Services: $25M
Over the past five years, EO revenues have increased by 65%, from $256M in to $423M in , growing on average 11% annually.
Space Exploration
In , Space Exploration revenues were stable at $112M, with a decrease of less than 1% from results, and representing 2% of total space revenues.
This sector of activity is almost exclusive to the upstream segment with 99% of revenues, as follows:
- Research, Engineering and Consulting: $66M
- Space Segment Manufacturing: $43M
- Ground Segment Manufacturing: $2M
The remainder of activities, which relate to the downstream segment, amount to roughly $1M as part of products or applications using exploration themes or data. There are no services associated with Space Exploration.
Navigation
From to , revenues increased by 8%, from $190M to $206M, which amounted to 4% of total space revenues.
Navigation is almost exclusively in the downstream segment in Canada. Products, Applications and Services are driven by consumer, business and government end-user demand. The downstream segment is 95% of the Navigation market, broken down as follows:
- Products and Applications: $163M
- Services: $33M
The remainder is broken down as follows:
- Research, Engineering and Consulting: $4M
- Space Segment Manufacturing: $5M
- Ground Segment Manufacturing: <$1M
Over the last five years (–), revenues from Navigation have decreased by 21%, or $55M. This represents an annual growth rate of -4.6%.
Space Science
Revenues increased by 47%, or $22.6M, from $47.7M in to $70.3M in . Space science represents 1.5% of total space revenues.
The market for space science is split in favour of upstream segment activities:
- Research, Engineering and Consulting: $44.8M
- Space Segment Manufacturing: $9.3M
- Ground Segment Manufacturing: $1.4M
With the remainder in the downstream segment:
- Satellite Operations: $1.3M
- Products and Applications: $8.3M
- Services: $5.1M
Over the last five years (–), revenues from Space Science have increased by 14%, or $9M. This represents an average annual growth rate of 2.7%.
Other Revenues
From to , other revenues increased by 94%, from $14M to $27M, which is 0.5% of total space revenues. Activities that fall into the "Other"
sector are by nature variable and subject to re-categorization; therefore, changes in this sector may be less statistically relevant than in the sectors noted elsewhere.
Market Share by Customer Location
Domestic vs. Export Revenues
In , total revenues for the Canadian space sector were $5.3B. Domestic revenues decreased by 3% year-over-year and accounted for 70% of total space revenues, while exports increased by 2% from to and represented 30% of revenues.
The average growth rate over the past five years was the following: 0.4% for the total space sector; 2.3% for domestic revenues; and -1.3% for exports. Footnote 7
When excluding broadcasting in all years, total revenues generated by the Canadian space sector over the last five years have increased from $2.67B to $2.73B. The average growth rate calculated using CAGR over the past five years was the following: 0.5% for the total space sector; 3.5% for domestic revenues; and -1.3% for exports.
See the data tables on page 37 for more information regarding inflation-adjusted amounts.
| Domestic | 138.57 | 145.18 | 139.21 | 147.62 | 160.14 | 155.02 |
|---|---|---|---|---|---|---|
| Export | 136.77 | 133.70 | 127.16 | 131.58 | 124.98 | 128.01 |
Note *To account for methodological changes to the survey in 2014 and enable consistency in data presentation, indexed values are calculated based on the year-over-year growth rate.
| Domestic | 1,735 | 1,818 | 1,743 | 1,849 | 3,826 | 3,704 |
|---|---|---|---|---|---|---|
| Export | 1,703 | 1,665 | 1,584 | 1,639 | 1,557 | 1,594 |
Export Regions
In , export revenues increased by 2%, or $38M, to $1.59B. Generally the longitudinal data show a growing export market for Canadian space-related goods and services; however, growth in the export market over the last five years has slowed, with a CAGR of -1.3% from to .
Segmentation of the $1.59B in total exports for is as follows:
- U.S.: 54%, or $854M;
- Europe: 22%, or $354M;
- Asia: 15%, or $232M;
- South America: 6%, or $100M;
- Africa: <1%, or $8M;
- Oceania: 1%, or $14M;
- Central America, the Caribbean and Mexico: <1%, or $7M; and
- Unallocated exports: 1.5%, or $24M.
| U.S. | Europe | Asia | S. America | Oceania | Africa | C. America, Caribbean, Mexico | Other | |
|---|---|---|---|---|---|---|---|---|
| 51.2% | 22.7% | 16.5% | 6.2% | 0.8% | 0.9% | 0.4% | 1.4% |
| U.S. | Europe | Asia | S. America | Oceania | Africa | C. America, Caribbean, Mexico | Other | |
|---|---|---|---|---|---|---|---|---|
| 53.6% | 22.2% | 14.6% | 6.3% | 0.9% | 0.5% | 0.5% | 1.5% |
| U.S. | 849.93 | 806.92 | 679.58 | 695.68 | 796.93 | 854.28 |
|---|---|---|---|---|---|---|
| Europe | 524.82 | 543.86 | 497.03 | 428.47 | 353.67 | 353.58 |
| Asia | 154.09 | 154.60 | 212.48 | 293.80 | 256.46 | 232.10 |
| Oceania | 46.18 | 44.90 | 46.82 | 42.19 | 12.02 | 14.09 |
| S. America | 69.62 | 82.90 | 90.70 | 87.08 | 95.82 | 100.10 |
| Africa | 17.02 | 16.52 | 20.62 | 26.99 | 14.15 | 8.40 |
| C. America, Caribbean, Mexico | 7.21 | 10.80 | 11.20 | 6.47 | 6.01 | 7.36 |
| Other | 34.50 | 4.64 | 25.24 | 58.04 | 21.54 | 24.41 |
The best performing export market for Canada's space organizations continues to be the United States in terms of revenues. Exports to the U.S. grew 7%, or $57M, from to .
Europe remained stable, still with $354M in . Revenues derived from Europe account for 22% of total exports.
Revenues derived from exports to Asia declined by 9%, or $24M, from $256M in to $232M in . Asia accounted for 15% of total exports.
In , exports to South America increased by 5%, or $4M, over . The region accounted for 6% of total exports, with $100M.
Export revenues from Africa decreased by $6M, generating $8M in , compared to $14M in . Generally speaking, growth in Africa has been uneven; years of strong growth have been followed by declines and vice versa. Africa accounted for less than 1% of total Canadian space export revenues.
Exports to Oceania totalled $14M, increasing by 17%, or $2M, over . Oceania accounted for 1% of total export revenues.
Market Share by Customer Type
Customers are classified as either government or non-government. Government customers include domestic government (municipal, provincial, federal civil, federal defence) and foreign government (foreign civil and foreign defence). Non-government customers include businesses, individual consumers and non-profit organizations or foundations (both domestic and foreign).
Overall, 11% of the space revenues in were derived from government sources and 89% from non-government sources. It is important to note that government customers make up the majority of market share in some sectors, such as Space Exploration and Science, whereas Satellite Communication customers are primarily non-government.
When comparing upstream and downstream segments, upstream segment organizations are much more reliant on government funding than downstream segment organizations, which derive their revenues almost exclusively from non-government clients. The upstream segment derives 52% of revenues from non-government clients, whereas the downstream segment derives 97% of revenues from non-government clients. It is worth noting that there are a number of downstream segment SMEs that are also heavily reliant on government as an anchor client, such as value-adding players in the Earth Observation sector. In that respect, they face similar drivers and challenges to SMEs in the upstream segment.
| Government | Non-Government | |
|---|---|---|
| Canadian space sector | 11% | 89% |
| Government | Non-Government | |
|---|---|---|
| Upstream segment | 48% | 52% |
| Government | Non-Government | |
|---|---|---|
| Downstream segment | 3% | 97% |
Domestic Customer Breakdown by Type
In , non-government revenues were the most significant part of the domestic market at 88% of revenues. Non-government customers can be individuals, as is the case with subscribers to television and radio broadcasting services—the largest component of domestic space-related activity. Other non-government customers include businesses, where space-derived information products are integrated into business operations (e.g. Navigation and Earth Observation data). A small portion of non-government revenues is tied to financing or sales to non-profit organizations and foundations.
Government customers make up the remainder of the domestic market and were focused in two areas: the upstream segment for research, engineering and manufacturing of space assets; and the downstream segment to ensure day-to-day government operations and services to the public. Government customers represent the majority of domestic upstream revenue, where they constitute 85% of revenues and non-government revenues constitute the remaining 15%. In the domestic downstream segment, the situation is reversed as government customers account for only 3% of revenues. The majority of government funding comes from federal sources: the CSA, the Department of National Defence (DND), the Natural Sciences and Engineering Research Council (NSERC), the Canadian Broadcasting Corporation (CBC) and the Canada Foundation for Innovation (CFI) were the top five sources of federal government revenue reported by companies and universities in .
| Federal Civil | Federal Defence | Non-Governement | Provincial | |
|---|---|---|---|---|
| 10% | 1% | 88% | 1% |
Foreign Customer Breakdown by Type
Non-government customers make up 92%, or $1.5B, of export revenues. Non-government customers are, therefore, the largest market segment abroad, just as they are domestically. This is equally true for both the upstream and downstream segments, where non-government revenues account for 84% and 95% of revenues, respectively.
Non-government exports are strong in three main areas of the value chain: Manufacturing, Satellite Operations, and Products and Applications. Regarding manufacturing, several companies are producing components and parts for foreign prime companies through global value chains, with very occasional sales related to manufacturing of complete end-to-end space systems. Satellite Operations include primarily sales related to operations for commercial telecommunications systems. Products and Applications sold to non-government customers are mostly related to antennas, receivers and other ground equipment in the Navigation and Satellite Communication sectors. Non-government exports for Earth Observation are limited, but a small market does exist for data, software applications and services.
There is also a small portion of non-government organizations, mainly foundations, which provide funding to Canadian universities and research centres. This is a relatively small amount and it is categorized as export revenue in the consolidated analysis of the Canadian space sector.
Government clients make up 8%, or $133M, of exports. Six percent of Canadian space exports are purchased by foreign governments for defence purposes, while 2% of Canadian space exports are purchased by foreign governments for civil purposes.
| Civil | Defence | Non-Governement | |
|---|---|---|---|
| 2% | 6% | 92% |
Workforce
The Canadian space workforce totalled 9,927 space-related full-time equivalents (FTEs) in . This represents a very slight decrease (less than 1% change) from the figure reported last year, 10,012 FTEs. Overall, the space sector workforce is evenly divided between upstream and downstream segment organizations with 53% and 47% of the total workforce, respectively. Note that workforce data do not include government employees.
Following methodological changes in last year's edition of this report, the CSA incorporated additional organizations involved in downstream segment activities last year, mainly related to broadcasting. As a result, total workforce increased significantly from to in the historical trend analysis. For that reason, an index is used in the graph below to detail total workforce growth year-over-year.
| Workforce | 123.04 | 111.68 | 119.12 | 122.67 | 124.46 | 123.40 |
|---|
Note *To account for methodological changes to the survey in 2014 and enable consistency in data presentation, indexed values are calculated based on the year-over-year growth rate.
Workforce Groups
In , engineers and scientists comprised the largest category of employment with 2,953 FTEs, representing 30% of the total space workforce. Employees in the administration category made up the second largest group with 2,911 FTEs and 29% of the total workforce. Technicians came third with 1,311 FTEs and 13% of the total workforce. Management, marketing and sales, and other employees made up the remainder.
The charts and graphs below provide a breakdown of the space sector workforce in .
Workforce by Region
- British Columbia: 6% (590 FTEs) of Canada's space workforce, a decrease of 4%, or 23 employees, over last year.
- Prairies: 9% (867 FTEs), an increase of 1% (9 employees).
- Ontario: 46% (4,581 FTEs), a decrease of 5% (239 employees).
- Quebec: 33% (3,298 FTEs), an increase of 6% (172 employees).
- Atlantic Canada: 6% (591 FTEs), a decrease of 1% (4 employees).
| Engineers & Scientists | Administration | Technicians | Management | Other | Marketing and Sales | Students/ Interns | |
|---|---|---|---|---|---|---|---|
| 29.7% | 29.3% | 13.2% | 6.5% | 7.9% | 4.8% | 8.5% |
| Management | Engineers & Scientists |
Technicians | Marketing and Sales |
Administration | Other | Students/ Interns | Total | ||
|---|---|---|---|---|---|---|---|---|---|
| B.C. | 56 | 314 | 105 | 31 | 48 | 0 | 36 | 590 | 5.9% |
| Prairies | 41 | 589 | 94 | 4 | 18 | 50 | 71 | 867 | 8.7% |
| Ontario | 318 | 1,082 | 579 | 254 | 1,325 | 476 | 546 | 4,581 | 46.1% |
| Quebec | 211 | 848 | 396 | 101 | 1,434 | 132 | 176 | 3,298 | 33.2% |
| Atlantic | 18 | 119 | 137 | 82 | 86 | 129 | 20 | 591 | 6.0% |
| Total | 644 | 2,953 | 1,311 | 473 | 2,911 | 787 | 849 | 9,927 | |
Highly Qualified Personnel (HQP)
The HQP measurement tracks the number of engineers, scientists and technicians employed in the space sector. In , HQP positions were stable, increasing by less than 1%, totalling 4,264 FTEs. HQP represent 43% of the total Canadian space workforce. In terms of upstream and downstream segments, the share of HQP is an important indicator that differentiates the profile of the workforce. In the upstream segment, 59% of the workforce are HQP, while in the downstream segment 25% of the workforce are HQP.
- 39% of Canada's total space HQP work in Ontario while 36% of Ontario's space workforce are HQP;
- 29% of Canada's total space HQP work in Quebec while 38% of Quebec's space workforce are HQP;
- 16% of Canada's total space HQP work in the Prairies while 79% of the Prairies' space workforce are HQP;
- 10% of Canada's total space HQP work in B.C. while 71% of B.C.'s space workforce are HQP;
- 6% of Canada's total space HQP work in Atlantic Canada while 43% of Atlantic Canada's space workforce are HQP.
| Ontario | Quebec | Prairies | Atlantic | British Columbia | |
|---|---|---|---|---|---|
| 39% | 29.2% | 16% | 6% | 9.8% |
| Total # Workforce | Total # of HQP | % of HQP Relative to its Own Region |
% of HQP Relative to National HQP |
|
|---|---|---|---|---|
| B.C. | 590 | 420 | 71.1% | 9.8% |
| Prairies | 867 | 683 | 78.8% | 16.0% |
| Ontario | 4,581 | 1,661 | 36.3% | 39.0% |
| Quebec | 3,298 | 1,244 | 37.7% | 29.2% |
| Atlantic | 591 | 256 | 43.3% | 6.0% |
| Total | 9,927 | 4,264 |
Innovation
Business Expenditures on R&D (BERD) (Companies Only)
In , there were 67 companies engaged in R&D activities. Total spending was $256M, a significant increase over R&D spending reported in ($146M). Upstream organizations were more R&D intensive, spending 55% of total space sector BERD.
R&D spending was financed through internal sources (e.g. company profits reinvested in R&D) or through external funding sources (e.g. government grants and contributions). Internally company-funded R&D represented the larger portion of spending at $139M or 54% of BERD in . Externally funded R&D represented 46%, or $117M, of BERD in .
| Large Firms | SMEs | |
|---|---|---|
| Firm Size | 39% | 61% |
| Downstream | Upstream | |
|---|---|---|
| Market Segment | 45% | 55% |
R&D Intensity Level (Companies Only)
R&D intensity is the proportion of BERD compared to the GDP contribution of the space sector. It serves as an indicator of the level of effort and investment by a company (or by an industry as a whole in this case) in innovative activities, for example, to create new products, services or technologies, or to improve business functions, such as production techniques. Overall, space sector R&D intensity is 19%. If we consider only the manufacturing segment, R&D intensity is 32%. This is nine times higher than the average for manufacturing in Canada.
Commercialization of Externally Funded R&D Projects (All Organizations)
Organizations report on the level of commercialization of projects that were initially funded by public monies (externally funded R&D). In , revenues derived through commercialization of externally funded R&D projects were $56M. The vast majority of commercialization takes place through companies (99%), with the remainder of commercialization taking place through universities and research centres.
Inventions and Patents (All Organizations)
In , 62 organizations reported having made an invention and 33 organizations registered a patent. Upstream organizations account for the majority of inventions and patents, with 71% of all inventions reported and 70% of patents filed. This is a reflection of the composition of survey respondents, with almost three-quarters of respondents in the upstream segment. Upstream and downstream organizations are otherwise inventing and patenting at very similar rates: 38% of organizations in both segments have claimed an invention in the past year; 21% of upstream organizations registered a patent and 20% of downstream organizations registered a patent.
The rate of patents and inventions has remained relatively the same over the past 10 years. Most organizations involved in inventing and patenting make on average 1 to 5 inventions per year and file for 1 to 5 patents per year.
Economic Impact Analysis
The methodology used for the following economic impact analysis is detailed in the Methodology section of this report. Results for are discussed below:
Economic Impact – Gross Domestic Product
In , the space sector contributed $2.7B to Canada's GDP, which represents the value of all final goods and services produced by the space sector within Canada. Total GDP contribution was broken down into the following:
- $1.48B in space sector impacts;
- $0.67B in supply industry impacts; and
- $0.6B in impacts related to consumer spending by associated employees.
The space sector creates benefits in the larger economy with a GDP multiplier of 1.86 (Total GDP Impact / Space Sector GDP Impact). In other words, every dollar that the space sector contributes to the GDP generates another $0.86 in GDP contribution from other organizations in the economy.
Economic Impact – Jobs Created
In , the space sector supported a total of 24,217 jobs in Canada. The total workforce contribution was broken down into the following:
- 9,927 space sector jobs;
- 7,489.5 supply industry jobs; and
- 6,800.5 jobs created and supported as a result of consumer spending by associated employees.
The space sector therefore creates jobs in the larger economy with a workforce multiplier of 2.44 (Total Workforce Impact / Space Sector Workforce Impact). In other words, every job in the space sector supports another 1.44 jobs in the economy.
| Direct | Indirect | Induced | |
|---|---|---|---|
| $B in | 1.5B | 0.7B | 0.6B |
| Direct | Indirect | Induced | |
|---|---|---|---|
| Workforce in | 9,927 | 7,489 | 6,800 |
Ten-Year Trend: –
| Revenues | 100.00 | 100.11 | 94.97 | 111.85 | 121.11 | 137.67 | 139.45 | 133.20 | 139.62 | 142.61 | 140.37 |
|---|
Note *To account for methodological changes to the survey in 2014 and enable consistency in data presentation, indexed values are calculated based on the year-over-year growth rate.
| Year | Overall Revenues | Domestic Revenues | Export Revenues | Workforce | ||
|---|---|---|---|---|---|---|
| (CAN$) | (CAN$) | % | (CAN$) | % | # | |
| $5,298,474,172 | $3,704,150,826 | 70 | $1,594,323,346 | 30 | 9,927 | |
| Footnote 8 | $5,383,048,299 | $3,826,446,289 | 71 | $1,556,602,010 | 29 | 10,012 |
| Footnote 8 | $3,561,901,723 | |||||
| $3,487,279,615 | $1,848,563,816 | 53 | $1,638,715,800 | 47 | 8,231 | |
| $3,326,974,904 | $1,743,304,247 | 52 | $1,583,670,656 | 48 | 7,993 | |
| $3,483,148,034 | $1,818,014,849 | 52 | $1,665,133,185 | 48 | 7,474 | |
| $3,438,626,684 | $1,735,256,380 | 50 | $1,703,370,304 | 50 | 8,256 | |
| $3,024,938,914 | $1,533,689,499 | 51 | $1,491,249,415 | 49 | 7,564 | |
| $2,793,722,219 | $1,388,532,603 | 50 | $1,405,189,616 | 50 | 6,742 | |
| $2,372,244,807 | $1,379,399,092 | 58 | $992,845,715 | 42 | 6,481 | |
| $2,500,364,235 | $1,400,914,765 | 56 | $1,099,449,470 | 44 | 6,678 | |
| $2,497,711,781 | $1,252,251,094 | 50 | $1,245,460,687 | 50 | 6,710 | |
Note *This chart reflects values that are not adjusted for inflation.
| Year | Overall Revenues (CAN$) |
Domestic Revenues (CAN$) |
Export Revenues (CAN$) |
|---|---|---|---|
| $5,298,474,172 | $3,704,150,826 | $1,594,323,346 | |
| $5,435,523,181 | $3,863,747,146 | $1,571,776,034 | |
| $3,573,527,257 | $1,894,282,624 | $1,679,244,633 | |
| $3,426,205,307 | $1,795,300,065 | $1,630,905,241 | |
| $3,675,342,111 | $1,918,329,760 | $1,757,012,351 | |
| $3,730,136,559 | $1,882,362,890 | $1,847,773,669 | |
| $3,351,600,447 | $1,699,311,807 | $1,652,288,641 | |
| $3,106,323,736 | $1,543,901,449 | $1,562,422,287 | |
| $2,682,592,246 | $1,559,858,113 | $1,122,734,133 | |
| $2,889,615,077 | $1,619,005,891 | $1,270,609,186 | |
| $2,956,953,347 | $1,482,496,136 | $1,474,457,211 |
Bank of Canada Rates of Inflation-Adjusted Revenues (Consumer Price Index data)
| Export | 100.00 | 88.28 | 79.72 | 112.82 | 119.73 | 136.77 | 133.70 | 127.16 | 131.58 | 124.98 | 128.01 |
|---|---|---|---|---|---|---|---|---|---|---|---|
| Domestic | 100.00 | 111.87 | 110.15 | 110.88 | 122.47 | 138.57 | 145.18 | 139.21 | 147.62 | 160.14 | 155.02 |
Note *To account for methodological changes to the survey in 2014 and enable consistency in data presentation, indexed values are calculated based on the year-over-year growth rate.
| Public | 100.00 | 131.78 | 113.56 | 111.02 | 126.69 | 135.17 | 155.93 | 144.07 | 152.97 | 190.68 | 189.41 |
|---|---|---|---|---|---|---|---|---|---|---|---|
| Private | 100.00 | 107.28 | 109.35 | 110.93 | 121.56 | 139.47 | 142.72 | 138.19 | 146.46 | 153.15 | 147.71 |
Note *To account for methodological changes to the survey in 2014 and enable consistency in data presentation, indexed values are calculated based on the year-over-year growth rate.
| Public | 236 | 311 | 268 | 262 | 299 | 319 | 368 | 340 | 361 | 450 | 447 |
|---|---|---|---|---|---|---|---|---|---|---|---|
| Private | 1,016 | 1,090 | 1,111 | 1,127 | 1,235 | 1,417 | 1,450 | 1,404 | 1,488 | 3,377 | 3,257 |
| U.S. | 593 | 499 | 499 | 733 | 782 | 850 | 807 | 680 | 696 | 797 | 854 |
|---|---|---|---|---|---|---|---|---|---|---|---|
| Europe | 401 | 323 | 283 | 399 | 408 | 525 | 544 | 497 | 428 | 354 | 354 |
| Asia | 100 | 134 | 120 | 150 | 152 | 154 | 155 | 212 | 294 | 256 | 232 |
| S. America | 79 | 40 | 32 | 52 | 64 | 70 | 83 | 91 | 87 | 96 | 100 |
| Africa | 30 | 26 | 6 | 11 | 8 | 17 | 17 | 21 | 27 | 14 | 8 |
| Oceania | 6 | 24 | 48 | 51 | 56 | 46 | 45 | 47 | 42 | 12 | 14 |
| C. America, Caribbean, Mexico | 4 | 4 | 5 | 7 | 8 | 7 | 11 | 11 | 6 | 6 | 7 |
| Other | 33 | 48 | 0 | 2 | 14 | 34 | 5 | 25 | 58 | 22 | 24 |
| U.S. | 593 | 854 |
|---|---|---|
| Europe | 401 | 354 |
| Asia | 100 | 232 |
| Satellite Commmunication | 100 | 97 | 95 | 111 | 121 | 141 | 140 | 138 | 143 | 139 | 138 |
|---|---|---|---|---|---|---|---|---|---|---|---|
| Navigation (GPS) | 100 | 118 | 139 | 228 | 217 | 233 | 202 | 154 | 163 | 170 | 184 |
| Space Exploration | 100 | 77 | 70 | 75 | 78 | 72 | 86 | 68 | 59 | 77 | 76 |
| Earth Observation | 100 | 146 | 91 | 108 | 140 | 139 | 146 | 175 | 201 | 279 | 229 |
| Space Sciences | 100 | 173 | 175 | 117 | 104 | 106 | 220 | 91 | 98 | 82 | 121 |
| Other | 100 | 123 | 129 | 167 | 240 | 252 | 296 | 258 | 226 | 143 | 278 |
Note *To account for methodological changes to the survey in 2014 and enable consistency in data presentation, indexed values are calculated based on the year-over-year growth rate.
| Satellite Commmunication | 1,930 | 1,874 | 1,832 | 2,146 | 2,326 | 2,729 | 2,703 | 2,655 | 2,769 | 4,503 | 4,461 |
|---|---|---|---|---|---|---|---|---|---|---|---|
| Navigation (GPS) | 112 | 132 | 155 | 254 | 243 | 260 | 225 | 172 | 182 | 190 | 206 |
| Space Exploration | 147 | 113 | 103 | 110 | 114 | 106 | 127 | 99 | 86 | 113 | 112 |
| Earth Observation | 185 | 269 | 168 | 200 | 258 | 256 | 270 | 322 | 371 | 516 | 423 |
| Space Sciences | 58 | 100 | 102 | 68 | 61 | 62 | 127 | 53 | 57 | 48 | 70 |
| Other | 10 | 12 | 13 | 16 | 24 | 25 | 29 | 25 | 22 | 14 | 27 |
| British Columbia | 100 | 148 | 93 | 102 | 124 | 120 | 142 | 160 | 153 | 209 | 190 |
|---|---|---|---|---|---|---|---|---|---|---|---|
| Prairies | 100 | 100 | 111 | 190 | 189 | 224 | 223 | 172 | 185 | 218 | 211 |
| Ontario | 100 | 102 | 109 | 123 | 126 | 141 | 146 | 139 | 144 | 146 | 149 |
| Quebec | 100 | 81 | 34 | 47 | 59 | 73 | 95 | 93 | 110 | 76 | 71 |
| Atlantic | 100 | 82 | 81 | 95 | 148 | 185 | 119 | 115 | 121 | 143 | 158 |
Note *To account for methodological changes to the survey in 2014 and enable consistency in data presentation, indexed values are calculated based on the year-over-year growth rate.
| British Columbia | 148 | 219 | 138 | 151 | 183 | 177 | 210 | 237 | 226 | 309 | 281 |
|---|---|---|---|---|---|---|---|---|---|---|---|
| Prairies | 123 | 123 | 137 | 234 | 232 | 275 | 274 | 211 | 228 | 268 | 259 |
| Ontario | 1,648 | 1,686 | 1,804 | 2,035 | 2,079 | 2,327 | 2,401 | 2,295 | 2,376 | 2,705 | 2,757 |
| Quebec | 367 | 299 | 123 | 172 | 216 | 267 | 348 | 340 | 402 | 1,797 | 1,667 |
| Atlantic | 212 | 173 | 171 | 202 | 314 | 393 | 252 | 244 | 256 | 304 | 335 |
| Workforce | 100 | 100 | 97 | 100 | 113 | 123 | 112 | 119 | 123 | 124 | 123 |
|---|---|---|---|---|---|---|---|---|---|---|---|
| HQP | 100 | 100 | 93 | 96 | 112 | 129 | 115 | 132 | 130 | 123 | 124 |
Note *To account for methodological changes to the survey in 2014 and enable consistency in data presentation, indexed values are calculated based on the year-over-year growth rate.
| Workforce | 6,710 | 6,678 | 6,481 | 6,742 | 7,564 | 8,256 | 7,494 | 7,993 | 8,231 | 10,012 | 9,927 |
|---|---|---|---|---|---|---|---|---|---|---|---|
| HQP | 3,365 | 3,375 | 3,126 | 3,242 | 3,771 | 4,344 | 3,873 | 4,434 | 4,362 | 4,226 | 4,264 |
| British Columbia | 100 | 38 | 68 | 70 | 78 | 98 | 105 | 120 | 88 | 138 | 132 |
|---|---|---|---|---|---|---|---|---|---|---|---|
| Prairies | 100 | 106 | 107 | 142 | 186 | 208 | 171 | 175 | 214 | 219 | 221 |
| Ontario | 100 | 101 | 101 | 102 | 109 | 118 | 102 | 99 | 104 | 101 | 96 |
| Quebec | 100 | 100 | 82 | 82 | 81 | 100 | 105 | 150 | 160 | 162 | 171 |
| Atlantic | 100 | 171 | 107 | 134 | 251 | 214 | 224 | 255 | 224 | 220 | 218 |
Note *To account for methodological changes to the survey in 2014 and enable consistency in data presentation, indexed values are calculated based on the year-over-year growth rate.
| British Columbia | 446 | 169 | 303 | 314 | 346 | 438 | 470 | 534 | 391 | 614 | 590 |
|---|---|---|---|---|---|---|---|---|---|---|---|
| Prairies | 393 | 416 | 419 | 557 | 731 | 815 | 670 | 689 | 839 | 858 | 867 |
| Ontario | 4,595 | 4,622 | 4,644 | 4,679 | 4,997 | 5,415 | 4,693 | 4,571 | 4,793 | 4,820 | 4,581 |
| Quebec | 1,006 | 1,008 | 824 | 829 | 810 | 1,008 | 1,056 | 1,508 | 1,609 | 3,126 | 3,298 |
| Atlantic | 271 | 464 | 291 | 364 | 680 | 581 | 606 | 692 | 608 | 595 | 591 |
| Total | 6,710 | 6,678 | 6,481 | 6,742 | 7,564 | 8,256 | 7,494 | 7,993 | 8,240 | 10,012 | 9,927 |
The State of the Canadian Space Sector Report provides insight for decision-makers in government and industry to help make informed, strategic choices for the future.
Canadian Space Agency
John H. Chapman Space Centre
6767 Route de l'Aéroport, Saint-Hubert, Quebec J3Y 8Y9 Canada
www.asc-csa.gc.ca