
Comprehensive Socio-Economic Impact Assessment of the Canadian Space Sector
By Euroconsult for the Canadian Space Agency
Final Report
March 27th, 2015
Contact details
Project manager: Adam Keith, Managing Director
Adresse: 465 rue McGill, Suite 1103, Montréal, Québec, H2Y 2H1
Telephone: (514) 750-9707 (direct)
(514) 291-3298 (cell.)
Email: keith@euroconsult-na.com
Table of content
- Executive summary
- Introduction
- The global space sector
- The Canadian space sector
- The economic footprint of the Candian space sector
- The strategic and social value of the Canadian space sector
- Conclusions
- Acronyms
- List of interviews
- Methodology note
- References
Case studies
- Case study #1 The Alberta energy regulator
- Case study #2 Space solutions for the energy and mining sectors
- Case study #3 ABB Canada's space activities and related benefits
- Case study #4 Neptec Technologies spin-off
- Case study #5 Canadian contribution to the NASA Phoenix mission
- Case study #6 Operation Driftnet
- Case study #7 A day without space in the North
- Case study #8 Lac Megantic
- Case study #9 Long duration space mission with Chris Hadfield (2012)
- Case study #10 Canadian participation to Argentina's SAC-D/Acquarius mission
- Case study #11 Polar view
Figures
- Figure 1: World government space expenditures
- Figure 2: 3 Decades government civil space expenditures in the world
- Figure 3: The space value chain
- Figure 4: World's industry revenues from space activities in 2013
- Figure 5: World satellites launched by type of operator (2004-2023)
- Figure 6: World satellites launched by applications
- Figure 7: Government funding and market shares in satellite communications (2004-2013)
- Figure 8: The 3 value chains of commercial satellite markets in 2013
- Figure 9: Government's approach to space (2014)
- Figure 10: Canada civil space budget
- Figure 11: Canada civil space spending, breakdown by application 2009-2014
- Figure 12: Share of Canadian government civil space investment in world's total
- Figure 13: Budget comparision of Canada with the top world 10 space programs
- Figure 14: The Canadian space sector value chain in 2013 ($ in million)
- Figure 15: Three ways to breakdown the Canadian space value chain
- Figure 16: Regional distribution Canadian space sector (2013)
- Figure 17: Distributions of companies by revenues
- Figure 18: Key revenue trends (2004-2013 CAGR)
- Figure 19: Revenue trends of the Canadian space sector
- Figure 20: Canadian space sector's total contribution to GDP (2013)
- Figure 21: Revenues vs. direct GDP contribution (2013)
- Figure 22: Canadian space sector's total job creation (2013)
- Figure 23 : Evolution of space sector vs. Canada employment (2008-2013)
- Figure 24: Canadian space sector direct employment breakdown (2013)
- Figure 25: Labour productivity of Canadian space sector
- Figure 26: Mapping of private sector and government department end users
- Figure 27: Canadian government earth observation data usage
- Figure 28: The Canadian space manufacturing industry and its connected sectors
- Figure 29: Part of budget allocated to technology transfer activities
- Figure 30: R&D expenditures by the Canadian space sector (2013)
- Figure 31: Space related scientific publications in three select disciplines published in Canada (2003-2012)
- Figure 32: Overview of DND main dedicated military space based infrastructure
- Figure 33: Major Canadian Armed Forces deployment abroad
- Figure 34: Canadian subscribers to satellite TV services (1995-2013)
- Figure 35: Canadian subscribers to satellite internet broadband services (2004-2013)
- Figure 36: Educational initiatives focused on young Canadians
- Figure 37: Social media activity of CSA and other agencies
- Figure 38: Distribution of agreements by application domain (1990-2014)
Tables
- Table 1: Top 10 space program funding worldwide
- Table 2: World government space expenditures by applications (2004-2023)
- Table 3: Key trends in satellite service markets
- Table 4: A selection of major current Canadian government space projects
- Table 5: Small and medium enterprise (SME) in the Canadian space sector (2013)
- Table 6: Space markets trends and Canadian market share
- Table 7: Overview of Canadian space sector's direct, indirect and induced impacts (2013)
- Table 8: Key federal government users of satellite-based services
- Table 9: A range of business users and applications
- Table 10: Two Canadian space players and their suppliers
- Table 11: New terrestrial applications developed through the CSA AETDP program (sample)
- Table 12: Spillover effects from CSA contracts surveyed (2005-2014)
- Table 13: Canadian space related research facilities and disciplines covered
- Table 14: A selection of space based solutions to climate change issues in Canada
- Table 15: A selection of space based solutions
- Table 16: Foreign vs. Canadian led projects in cooperation missions (1990-2014)
Executive summary
The Canadian space sector and its environment
The world context for space activities is changing
The international space sector is experiencing profound change. Countries with historical leadership in space have been under pressure as a result of a tough financial environment leading to the redefinition of their priorities. In the meantime, new leaders such as China and India have affirmed their ambitions in space through massive investments in the development of their capabilities, while a flourishing number of countries now invest in space, shaking up the international hierarchy.
Changes are no less significant in the market environment of the space industry that faces significant evolution along its value chain, from upstream to downstream. Space industry players worldwide have to rethink their business models and strategies as they experience disruptive innovations, a tougher competitive environment and new drivers impacting the manufacturing, launch and services businesses.
Canada: A pioneer in space looking for new ambitions
Canada realized early on the benefits it could derive from the development and use of space technology. Since the launch of Alouette more than 60 years ago its space sector has pioneered the development and application of advanced space technologies:
- Canada was the first country to operate a commercial domestic communications satellite (Anik) from geostationary orbit in 1972, to deploy a direct-to-home broadcasting service in 1978 and to introduce two-way broadband internet across the country in 2004.
- Canada pioneered operational Synthetic Aperture Radar satellites with the RADARSAT series, the third generation currently under development.
- Canada established itself as a world leader in space-based robotic technologies and vision systems with the iconic Canadarm program.
Recently however, Canada has lost its place in the group of the world's leading space programs. Over the years, Canada's investment in its space program has seen a downward trajectory with the Canadian Space Agency's baseline budget now under $300 million, which is below to that of 1999. Despite some additional targeted allocations or acquisition programs, this lower funding level challenges the ability of the country to grow its technological capability in space.
The adoption of the national Space Policy Framework in 2014 provides long-term guidance that is critical for all Canadian stakeholders. It also reinforces the strategic character of space activities for the country by reaffirming the alignment of the national space program with government's strategic priorities.
200 active organizations generating $5.4 billion in revenues
The Canadian space sector is comprised of over 200 organizations involved at different levels of the space value chain and employing a total of 9,784 workers involved in a wide array of highly qualified jobs. It is estimated that this sector generated cumulative revenues of $5.37 billion in 2013 when taking into account Canadian satellite broadcasting activities, and $2.63 billion when excluding these activities.
Prominent aspects of the Canadian space sector include:
- Revenues growing at a rate superior to that of the Canadian economy (3.7% on average during the last five years compared to 1.8%), driven by a dynamic downstream sector.
- Revenues are concentrated with the 10 largest firms accounting for almost 90% of the industry's total.
- SMEs account for nearly 90% of all organizations, but with small space-related revenues.
- The downstream (service) sector generates 79% of the revenues and posts the highest growth.
- Satellite communications, commercial and export markets represent key drivers.
- Ontario and Quebec together account for approximately 80% of sector revenues and employment.
Share of Canadian firms in the world space markets
The global space industry generated revenues estimated at US$250 billion in 2013, of which 80% was for commercial activities (essentially derived from services, in particular satellite television) and 20% for government activities (essentially derived from manufacturing activities). The share of the Canadian space industry in the world market is estimated at nearly 2% which is a good performance when considering that Canada accounts for less than 1% of the world's total funding for civil space activities.
It should be noted that the Canadian industry records its highest market share in the commercial satellite manufacturing market (for telecommunications). However, eroding R&D investments in the national space program challenge the position of Canadian companies in a tough, globally competitive market.
The economic impact of the Canadian space sector
Canadian space sector's direct, indirect and induced benefits
The Canadian space sector's overall contribution to Canada's GDP represents the value-added of the industry for the national economy (it is therefore different from the sector's revenues). Taking into account its direct, indirect and induced effects, the Canadian space sector generated in 2013:
- An economic multiplier of 1.85 (ratio of direct GDP contribution to indirect and induced contribution) with a total GDP contribution of $2.9 billion.
- An employment multiplier of 2.5, with 24,354 full-time equivalent jobs.
- $750 million of tax revenues to federal, provincial and municipal governments.
While methodologies for calculating economic benefits can diverge between studies, it was found that the Canadian space sector's multipliers are equivalent, if not superior to other Canadian industries (such as aviation) and other countries' space sector (such as the UK).
Other important outcomes from the study regarding the Canadian space sector's economic impact include:
- Services and manufacturing are the biggest contributors to its GDP impact accounting respectively for 55% and 30%.
- 45% of its direct GDP impact is made by SMEs.
- The sector has grown nearly six times faster than Canada's national job market.
- The sector is a magnet for highly-qualified personnel (engineers, scientists and technicians), who accounted for 53% of its workforce.
- With a GDP per worker of roughly $160,000, its workforce was over twice as productive as Canada's broader industrial workforce.
The space sector diffuses wider effects on Canada's national economy
The Canadian space sector produces wider effects on the national economy as it boosts innovation, knowledge and productivity from suppliers to end-users.
Over one thousand Canadian public and private organizations coming from multiple sectors are active users of space-based solutions. Canada's top business users include such sectors as energy, agriculture, forestry, engineering/infrastructure, retail, finance, media, telecom and transportation. They rely on space to enable, secure or improve their business operations by monitoring remote or inaccessible regions, collecting key information for their decision making, or ensuring connectivity across their networks. As such, space represents a key enabler to generate cost savings and efficiency gains.
The space sector also fosters the creation and the diffusion of knowledge and innovation in the Canadian industry, research and scientific communities:
- It invested roughly $180 million in R&D in 2013, which corresponds to an R&D intensity of 11% of the sectors' GDP impact, much higher than any other major national industry.
- For each dollar invested through Canadian Space Agency contracts, another $1.2 is created in spill-overs benefits to the economy beyond the value of the initial contract value.
- Close to 50 Canadian research institutions and universities are engaged in space-related academic programs in the science, engineering, policy and legal fields.
- Canadian researchers in space-related disciplines issued 2,507 publications accounting for 6.9% of the world's total, i.e. part of world's best performance.
The space sector relies on a wide range of technologies, equipment and products, implying technology transfers with other industries. On the one hand, space is a strong vector for suppliers to improve their product quality, implement world-class standards, stimulate engineering teams and showcase their capabilities. On the other hand, the cost of technology adaptation and the lack of long term business predictability from government contracts can make space business unsustainable for the smallest companies. Such constraints have already pushed several Canadian companies to reduce or even cease their space operations.
The strategic and social value of the Canadian space sector
Support Canada's security and sovereignty
Today the Canadian defence and security community is a mature operational user of space-based solutions. The Department of National Defence (DND) has engaged in an ambitious plan to acquire and develop space-based capabilities. This includes domestic assets such as Polar Epsilon/RADARSAT-2 (Earth observation), M3MSAT (Automatic Identification System), NEOSsat and Sapphire (space surveillance). It also includes cooperation programs with allied countries such as with the U.S. DoD for satellite communications. These space-based assets are considered to be critical for DND to undertake its missions, including:
- Maritime domain awareness: To monitor illegal criminal activity, track ships, enforce laws and regulations, protect against severe weather, search and rescue, etc.
- Arctic sovereignty: Space-based assets are the only reliable solution to provide communications, positioning and intelligence over the Arctic.
- International operations: The 1,500 Canadian military personnel deployed around the world rely on satellites to conduct their operations.
Space is part of Canadians' everyday life
The space sector has grown to be increasingly prevalent in the everyday lives of Canadians:
- Space plays an essential role in improving Canadians' quality of life through accurate weather information delivered by Meteorology Services Canada, or the usage of GPS along over one million kilometers of Canadian roads.
- Space supports the distribution of more than 1,200 TV channels to 2.7 million households. It has been part of the backbone of the national television network since its early days.
- Space contributes to help bridge the digital divide where terrestrial networks cannot be implemented or are at a prohibitive cost. 200,000 national households rely on satellite for internet access, making Canada the second largest market in the world. Satellite is a primary, and sometimes the only, source of connectivity, such as in the North where it provides vital social and economic links with the rest of country and the world.
- Space plays a pivotal role in supporting the populations' safety: The COSPAS-SARSAT system, headquartered in Montreal, has aided in the rescue of 1,500 Canadians since its inception in 1982. The Coast Guard also employs space-based solutions while responding to maritime distress situations, helping save 2,200 Canadian lives each year.
- Space is also a source of inspiration: the Canadarm and Canadian astronaut program have inspired generations of Canadians. With over 200,000 YouTube subscribers and 5 million annual visitors to its website, the CSA performs at a level equivalent to that of top national associations and agencies.
Space helps protect and manage our environment
Space solutions have unique advantages for both climate change monitoring and natural resource management, helping governments and private enterprise protect and manage our environment. Satellite data provides essential information to multiple sectors (including agriculture, forestry and oil and gas), generating benefits such as assessments of crop health and yield, improving security through monitoring of expansive territory and identifying pollutants in the lakes and oceans.
The importance of monitoring climate variables in Canada is vital considering the size of the Canadian land mass (over 10 million Km²), the extent of its ocean borders (244,000 km, the longest in the world) and its significance as a host for extensive forested and ecologically sensitive areas. Data collected over Canada further serves as an input in global environment monitoring. Leveraging its space-based assets, Canada can monitor global climate change as well as phenomena over Canadian territory.
Canada is a resource-rich country: The energy and mining sectors contributed over $170 billion to Canada's GDP in 2013 (over a quarter of the value of the goods-producing economy), its agriculture and agri-food sector generated $103.5 billion, its forest sector $57.8 billion. In addition, Canada has the third highest reserve of drinkable water in the world. Space-based data is used across government and private sectors to manage and monitor those resources, as well as to ensure efficient and secure business practices. This is key for Canada's economy and resource sustainability.
Space fosters international collaboration
Canada has been able to augment its national program through broad collaboration with international partners. Since its inception, the Canadian Space Agency has signed close to 200 bilateral and multilateral agreements with over 24 international partners, including 78 agreements with NASA. Through international cooperation, Canada generates multiple benefits such as participating in projects it could not afford on its own, accessing critical information and data from other nations' satellites, meeting its international obligations or exporting technology and expertise.
The development of new capabilities through international partnerships helps Canadian companies boost visibility in the global market. For example, Canada enjoys a specific position within the European Space Agency as a Cooperating State since 1979. Canada receives substantial benefits for this investment that enables its industry to participate in large-scale international and R&D programs, further creating significant strategic and business opportunities.
Conclusions: Opportunties and challenges for the Canadian space sector
The development of leading-edge capabilities from selective investments has been a priority of the national space program. Over the years, Canadian suppliers have developed world-class expertise in areas such as robotics, sensors, scientific instruments and telecommunications payloads. In many aspects the Canadian space sector has reached a relative level of stability with a regular revenue base and a dynamic downstream sector thanks to investments made upstream in space technology. This vitality diffuses benefits across Canada with multiple economic, strategic and social impacts across the nation.
However, this report has highlighted several factors that affect the impact of the Canadian space sector for the country. The following are considered the most critical::
- As the global context for space activities is rapidly changing and Canadian investment in its space technological capabilities decreases, its position on the international scene is challenged. Although a G7 country, Canada dedicates much less of its GDP to its civil space activities than the world average. Its baseline funding will likely not enable Canada to maintain its space capabilities in the long term. In addition, budget instability and unpredictability affects the most fragile players, especially SMEs that form a critical part the Canadian space sector's ecosystem.
- When taking into account defence, the Canadian government's total investment in space has actually increased quite significantly. However, the return of these investments remains limited for the Canadian space sector as a large part is spent on foreign programs. Considering the scale of the investments, this is a non-negligible shortfall for the Canadian space sector.
- Canadian government investment in space has not always supported domains showing high market potential, limiting the possibility to turn this initial investment into larger economic gains for the space sector. As result, several industry players have been progressively pushed away from the Canadian space program. In addition, this situation fosters at the same time dependency for a segment of the industry on government-specific requirements and cycles of decisions and investments.
- Many successful companies focus on the export market which can represent up to 90% of their revenues, with little dependency on government R&D or support programs. While a sign of commercial maturity, in the longer term it could create a risk for business sustainability and key technological capabilities and furthermore cause a disconnect between industry technological capabilities and government national requirements.
- The Canadian industry has made significant investments outside Canada, including foreign acquisitions and the implementation of facilities in other countries. While it shows the dynamism of the largest Canadian companies, they choose to invest outside Canada to grow their business. Conversely, Canada does not attract enough foreign investment in its space sector, whereas this would provide additional capital and grow its technology base.
- Outside a few large programs, Canada offers limited opportunities to undertake programs in partnership between the public and the private sectors. Whether for R&D or the delivery of operational services, large to small scale projects, many countries have implemented a larger portfolio of cooperation schemes allowing the flexible implementation of programs and expanding funding sources.
- Finally, only a healthy indigenous space industry can generate the benefits that Canada can expect to accrue in the future from its space investments and, more generally from space activities whether these activities are based on Canadian or foreign space assets.
This report does not aim to formulate recommendations, but several elements could be considered to increase the impact of the Canadian space sector, including:
- The review of mechanisms used in other sectors or in other countries, and the assessment of their implementation in Canada. Whether for investment strategies, partnerships, co-funding mechanisms, technology transfers, regulations, support to start-ups or SMEs, interesting lessons learned could be collected and shared from their experience.
- Based on the 2014 Space Policy Framework, the definition of a national strategy for space technology and industry associating all components of the Canadian space program (civil and defence, industry and scientific communities). Such a national strategy, outlining a long-term action plan related to strategic capabilities, would be key to ensuring the sustainable long-term impact of the national space sector for Canada.

Text version of Socio-economic impact of the Canadian space sector image
Socio-economic impact of the Canadian space sector
The infographic presented is a series of boxes with small visual characteristics to define each segment of the economy or society being referenced.
The first graphic is a series of blocks regarding the general impact of Canada's Space Sector. Canada generates $5.4 billion in revenues from the Space Sector. The Upstream Sector generates $1.1 billion, and specializes in Space Systems ($825 million), Ground Systems ($135 million), and Research and Engineering ($96 million). The Downstream Sector produces $4.3 billion in revenues, and is concentrated in Consumer Services ($2.820 billion), Satellite Operations ($1.113 billion), and Terminals Systems ($385 million).
The next graphic is a small building with some statistics to the side. There are 226 organizations involved in the Space Sector, of which 200 are Small to Medium Enterprises (SMEs). The 10 largest firms account for approximately 90% of the revenue.
The following graphic is an outline of a person with some statistics to the side. A large number of personnel in the field are highly qualified (53%), creating $160,000 in GDP per professional, which is twice the national average. Job creation in the Space Sector is six times faster than the national rate.
A graphic that displays a trending upwards arrow represents the CAGR. The Compound Annual Growth Rate for the Space Sector is 3.6% over 5 years, which is double Canada's economy at 1.8%.
Three blocks overlaying a map of the world list the influence that Canada has on the world stage. Canada's status in the Space Sector is represented by 24 international government partners, accounting for 2% of the world industry market share, and represents 1% of all civil space funding.
Next, a small graphic displays the GDP, Jobs, and Tax benefits accrued to the Canadian economy through a series of stated facts encircled by their corresponding direct, indirect, and induced characteristics. The economic footprint of the Space Economy is 24,354 jobs, $2.9 billion in GDP, and approximately $750 million in tax revenues from direct, indirect, and induced investment.
Another graphic representation of computers, televisions, satellites, etc. matches corresponding facts listed to the side. The descriptions follow: Space impacts everyday lives by bringing 1,200 satellite channels, 2.7 million TV subscribers, 40 million location based services via GPS, 50%of arctic households connected by satellite, and 200,000 satellite internet access subscribers. Furthermore, the online community for the CSA is represented by 152,000 Twitter followers, a Youtube channel of 220,000 subscribers, and 88 videos, millions of viewers and live events on the ISS by Canadian astronaut Chris Hadfield.
Finally, a graphic of various industries is presented with visual representations for each segment and a dollar figure attached to display its influence. The information follows: Space is critical for research and development (R&D; $180 million), military personnel conducting operations (1,500 people), tracking ships in Canadian waters (4,000 every day), and passengers travelling through Canada's airports (120 million a year). Additional benefits include Canadian lives saved every year through space related assistance (2,200 people), operations that support the energy sector ($170 billion dollar industry), precision agriculture for Canadian farming operations (205,730 beneficiaries), and the management of Canadian freshwaters and land (10 million square kilometers).
Introduction
In moving forward with the implementation of Canada's Space Policy Framework, unveiled in February 2014 by Industry Minister the Honourable James Moore, the Canadian Space Agency (CSA) is undertaking a series of studies to support the development of a "Value Proposition for Space" aimed at demonstrating how space investments contribute to Canada's economic growth and job creation. The Value Proposition will support informed decision-making for future policies and investments in the space sector.
In this context, the present comprehensive socio-economic impact assessment of the Canadian Space Sector study has for objective to capture the macro-economic level of space sector impact and to enhance the knowledge of the direct, indirect and induced benefits resulting from space activities in Canada, whether public or private.
This study has been completed on the basis of multiple sources of information, including:
- An extensive review of socio-economic studies performed in the space sector and other sectors in Canada and worldwide.
- Desk research to collect information required to perform the analysis. Particular attention was brought to other studies or activities performed by the CSA or other government departments with information of interest for the purpose of this study.
- Consultation with actors from the Canadian Space Sector and government departments, which enabled us to obtain primary data and direct information from stakeholders. 43 interviews were conducted. A detailed list is provided in Annex.
- A review of information available in-house from Euroconsult's most recent research activities.
This report is structured into five distinct sections:
- The Global Space Sector, which reviews the worldwide context for government and commercial space activities;
- The Canadian Space Sector, which reviews the Canadian specific context for government and commercial space activities;
- The Canadian Space Sector's economic footprint, which encapsulates in quantitative and qualitative terms the impacts of the space sector on Canada's economy from suppliers to end-users;
- The Canadian Space Sector strategic and social value, which reviews the wider benefits generated by the Canadian Space Sector to Canada for its security and sovereignty, its population, its environment and its position on the international scene.
- Conclusions
The global space sector
1. Government space activities worldwide
1.1 Global context in transition
Governments' actions are critical for the space industry through 1) their investment in R&D in a technology complex sector, and 2) the creation a favorable policy and regulatory environment for the emergence and development of space-based applications and services. After two decades of continuous growth, global government investments in space have stagnated since 2010. With US$72 billion spent worldwide, 2013 marked the first time investments in annual expenditures decreased since 1995. With close to US$44 billion, civil programs account for 61% of global funding for space, a growing share since 2009. Military expenditures have dropped by 15% since 2010 as a result of massive reductions in the U.S. following a decade of nonstop increases. This pressure on public finances, notably in North America and in Europe, has seriously affected governments' ability to support their national space programs, with direct impacts on the civil and defence agencies running these programs and the industry contractors executing them.
Figure 1: World government space expenditures (US$ in billion)
| 1994 | 1995 | 1996 | 1997 | 1998 | 1999 | 2000 | 2001 | 2002 | 2003 | 2004 | 2005 | 2006 | 2007 | 2008 | 2009 | 2010 | 2011 | 2012 | |
|---|---|---|---|---|---|---|---|---|---|---|---|---|---|---|---|---|---|---|---|
| World | 30.18 | 28.21 | 29.15 | 32.84 | 34.53 | 36.14 | 36.74 | 37.23 | 40.39 | 43.74 | 47.34 | 50.39 | 53.23 | 58.32 | 63.53 | 69.67 | 71.30 | 71.47 | 72.91 |
| Defense | 9.6 | 7.4 | 8.2 | 12.6 | 13.4 | 14.6 | 15.5 | 15.9 | 17.7 | 19.6 | 21.7 | 23.2 | 24.5 | 27.6 | 30.5 | 33.7 | 33.5 | 31.6 | 31.7 |
| Civil | 20.6 | 20.8 | 21.0 | 20.3 | 21.2 | 21.5 | 21.3 | 21.4 | 22.7 | 24.2 | 25.7 | 27.2 | 28.7 | 30.7 | 33.0 | 36.0 | 37.8 | 39.9 | 41.2 |
Source: Euroconsult
The international context of space activities has significantly changed in the last 20 years as a flourishing number of countries invest in space around the world: 58 countries had a space program in 2013, compared to 37 in 2003. Such dynamism demonstrates how space technologies and applications are seen by governments as a valuable investment in order to support their national social, economic, strategic, and technological development. These emerging space-faring countries open up new institutional and industry cooperation opportunities for established players, including Canadians, but also new challenges as they look to develop domestic technologies that may ultimately compete with existing players in the international market. Figure 2, on the following pages, shows the growth in space-faring nations over the past three decades.
Figure 2: Three decades government civil space expenditures in the world
(Countries spending over $10 million only)
(Current US$ in million)
Figure 2a - 1990 = 15 countries

Figure 2b - 2003 = 37 countries

Figure 2c - 2013 = 58 countries

Figure 2 - Text version
Figure 2 consists of three separate infographics covering three decades of government civil space expenditures around the world, labelled a, b, and c. The graphics only include countries that spent over 10 million on space related activities.
The first graphic is Figure 2a representing space expenditures in 1990. The image displays a series of bubbles, each representing a country, that are then grouped together and color coded according to their area of operations (North America, Europe, Russia, and Asia). The visualization includes 15 countries involved in space activities, and the size of each country bubble is represented by their space budget in U.S. millions. The United States is by far the biggest spender ($12,460), followed by Russia ($5,232), all of Europe ($4,000), the European Space Agency (ESA) ($2,429), and Japan ($1,124). Many other countries made significant contributions, but Canada was one of the smallest with $222 million U.S. budgeted for space.
Figure 2b follows the same visualized bubble representation, but covers 37 different countries in 2003. Again the United States was the largest investor in space activity ($15,200), followed by Europe ($4,562), the ESA ($3,528), and Japan ($2,257). Russia's contributions significantly declined in this period, investing only $245 million in space related activities. Another area of operations was added as well, with Brazil ($56) and Argentina ($30) beginning investments in space. Many other countries made significant contributions, but Canada was again one of the smallest with $219 million U.S. budgeted for space.
Figure 2c follows the same visualized bubble representation, but covers 58 different countries in 2013. Again the United States was the largest investor in space activity ($19,770), followed by Europe ($8,926), a reinvigorated Russian program ($6,414), the ESA ($4,909), and China ($2,384). Another area of operations was added as well, with numerous African countries beginning investments in space. Many other countries made significant contributions. Canada had average contributions compared to other countries, investing $473 million U.S. budgeted for space. It should however be noted that this may represent a one-time investment, as Canada has had a consistent budget for space activities of $300 million Canadian dollars.
1.2 Trends in national space programs
Public investment for space remains concentrated with the five largest national space programs (U.S., Europe, Russia, Japan and China). This concentration has decreased over time (from 97% in 2004 to 93% of the world's government spending in 2013) but is expected to remain stable in the coming decade. The top 10 programs worldwide have undergone compelling changes with a group of historical players experiencing strong budget pressure (U.S., Europe, Japan) along with those who have affirmed their global leadership in the last decade with a significant investments (Russia, China, India). Besides these top 10 space programs, 18 countries recorded over US$100 million in spending (including Canada) and 30 other countries invested between US$10 million and US$100 million in their national space programs.
| Country/ organizationFootnote 1 |
2013 Funding (US$) / 5Y CAGR | Recent trends |
|---|---|---|
| USA | 38.7B/-3% | Transition period both for civil and military programs. Leadership under pressure. Increasing focus on commercial/international partnerships. |
| Russia | 11B/32% | Historical peak funding resulting from ambitious plan to modernize space-based infrastructure & guarantee national independence |
| China | 4B/15% | Priority towards ambitious plans for manned spaceflight, launcher, navigation and Earth observation activities. Support to export. |
| Japan | 3.3B/3% | Defence drives national investment growth. Space program shifts from technology focus to space utilization and commercialization. |
| France | 2.9B/1% | Stable funding despite budget pressure. National space industry is heavy weighted towards manufacturing and launch which drives national priorities. |
| Germany | 2.1/5% | New leadership in the European space program. Becomes the first European Space Agency (ESA) contributor focusing on capability building and satellite applications. |
| EU | 1.6/40% | A key stakeholder for space in Europe, though challenging completion of Galileo and Copernicus leave ambiguity on future mandate. |
| India | 1.2B/14% | Historically oriented towards civil applications, now also defence and security. A model for space program development in developing countries. |
| Italy | 1.1/3% | Budget situation raises cloud of uncertainty concerning government's ability to respect national program commitments, notably those for ESA. |
| UK | 0.8/6% | Recent decision to boost national space strategy raised UK's position within ESA. History of partnership with private sector and application driven. |
Source: Euroconsult
Trends by key space applications include:
- Manned spaceflight represents the first spending item: $10.9 billion in 2013 driven by the development of next-generation transportation systems and orbital infrastructures. Only seven countries plus ESA invest in such programs. The U.S. accounts for 70% of total funding, but China will account for 25% of spending by 2023.
- Earth observation received $10.7 billion in 2013 driven by civil programs to be undertaken in 62 countries by 2023 generating enormous growth in satellite launches. Funding will gradually drop once large programs pass their investment peak around 2017. Asia will become the top region accounting for 37% of expenditures in 2023.
- The development of next-generation launch vehicles in multiple countries boosts expenditures related to launcher programs (15 countries/agencies, $8.6 billion in 2013). Global funding stability is expected through the decade. Launchers can represent between 15% and 50% of the agencies' budget when such programs are undertaken.
- Satellite communications is estimated at $7.2 billion in 2013, dropping to $5.9 billion by 2023 due to declining military expenditures. Civil programs drive expenditures which is reflected in the growing number of countries investing. 185 communications satellites are expected to be launched of which two thirds will be in Russia and Asia.
- Space science and exploration totalled $5.6 billion in 2013 and is expected to reach $8.3 billion in 2023, driven by ambitious plans in Russia and Asia, and a sustained high level of investment in the U.S. 25 agencies invested in space science and exploration but five countries represent 92% of total spending.
- Satellite navigation reached $4.3 billion with only five countries plus the European Union investing in the development of these systems. Increasing funding is expected to support systems' deployment reaching an all-time high of $5.6 billion in 2020. 124 positioning and navigation satellites are expected over the next decade.
| ApplicationsFootnote 2 | 2004 | 2013 | 2023 | |||
|---|---|---|---|---|---|---|
| # Countries | US$ billion | # Countries | US$ billion | # Countries | US$ billion | |
| Earth observation | 28 | 6.5 | 55 | 10.7 | 62 | 10.8 |
| Satcom | 20 | 3.9 | 48 | 7.2 | 61 | 5.9 |
| Science | 18 | 5.8 | 25 | 5.6 | 28 | 8.5 |
| Launchers | 11 | 2.7 | 15 | 8.6 | 16 | 8.2 |
| Security | 4 | 1.3 | 8 | 2.7 | 11 | 3.2 |
| Satnav | 6 | 1.4 | 9 | 4.3 | 9 | 5.2 |
| Manned spaceflight | 7 | 9.1 | 8 | 10.9 | 8 | 17.6 |
Source: Euroconsult
2. The space industry worldwide
2.1 The space value chain
The value chain that allows the delivery of space-based services includes a wide range of stakeholders acting at four different levels:
- Government agencies who fund space technology R&D for their own use and for dual-use purposes
- The upstream space sector that includes a limited number of players who design and manufacture space systems, their launch vehicles and ground infrastructure.
- The downstream space sector that includes:
- The satellite operators who own and operate the satellite systems and market their capacities to the service providers;
- Service providers and terminal suppliers who deliver communications, navigation and geographic information services to end users by integrating the satellite signal into packaged solutions.
- The end users, whether governmental (civil/military) or commercial (business or customer) who do not ask for the satellite technology per se but rather for solutions tailored to their needs, whether for better communications, navigation or geographic information services.
The distinction between the upstream and the downstream segments of the value chain is a moving frontier as stakeholders can be vertically integrated and involved in multiple business segments, from technology development to service provision. Nevertheless, this distinction remains essential in order to understand the structure of the space industry and the business model(s) pursued by its players.
Figure 3 provides an overview of the entire space sector value-chain.
The upstream space sector
The upstream space sector includes a variety of research, engineering, manufacturing and service activities intended to support the development and launch of space systems and capacity.
Research and engineering activities are undertaken by a large number of private companies and public organizations (research centers, universities etc.), from large to very small organizations, that undertake technology innovation for space systems and sub-systems. Governments (through space agencies) and large industry players (such as space systems manufacturers) are critical to fund and support research and engineering activities.
Space system manufacturers design, develop, assemble, integrate and test satellites, spacecraft, other probes, and launch systems, as well as the ground systems that are intended to command and control the space segment. Their objective is to maximize the profitability of their activity while maintaining their technological capabilities. The manufacturing segment is composed of a limited number of Tier 1 (prime) system integrators and their supply chain. The supply chain is composed of a larger number of Tier 2 and 3 companies designing and manufacturing subsystems, parts and components that they deliver to the integrators, either domestically or internationally.
Similar to space systems manufacturing, satellite launching is a low margin activity. This underlines the primary role of public institutions in the development and production phases of the launch vehicles as autonomous access to space is often a strategic priority for space powers. Launch vehicle manufacturers and service providers rely on:
- The long development cycle of a new launch vehicle (up to 15 years) that requires extensive public funding and continuous R&D support
- The ability to put in place efficient industrial processes, with the objective of optimizing the costs, reliability and production rate of the launch systems
Ground systems manufacturers produce a range of equipment needed to receive, process and manage the signals transmitted by spacecraft, as well as track and control the satellite in space. These manufacturers specialize in radio-frequency components and systems, large gateway antennas and network hub systems used by satellite operators, teleports and service providers.
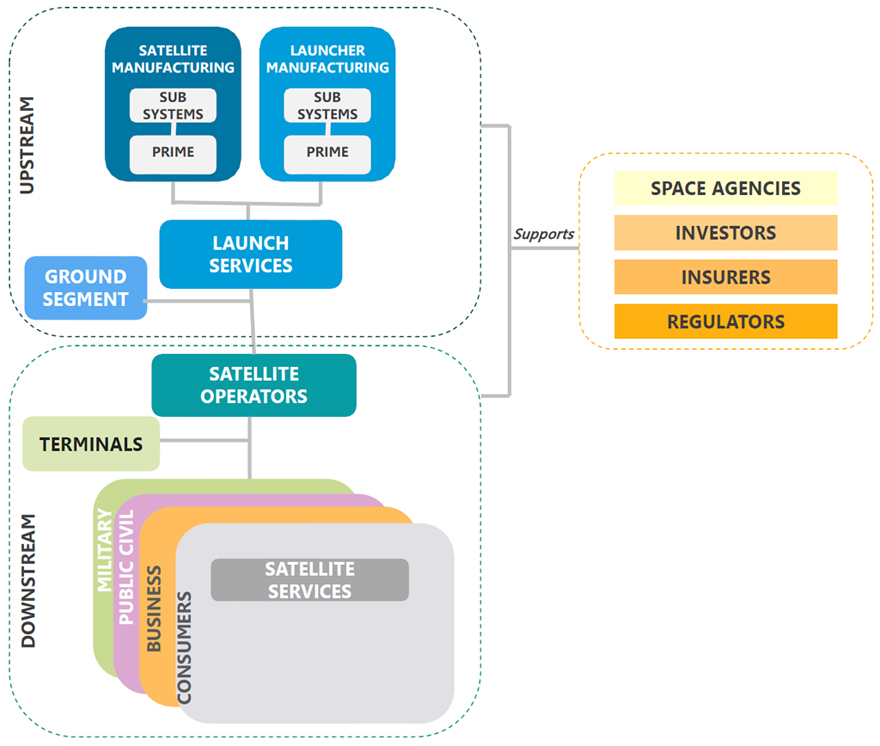
Figure 3 - Text version
The Space Value Chain is broken down into three different segments (Upstream, Downstream, and Space Agencies) represented visually as blocks. Each corresponding block is connected to one another. Inside of each block are the sub-segments which influence its function. The Upstream is composed of Launch Services, which includes a Ground Segment, Satellite Manufacturing (sub systems and prime systems), and Launcher Manufacturing (sub systems and prime systems). The Downstream is composed of Satellite Operators, which make use of Terminals, and provide services to Consumers, Business, Public Civil needs, and Military needs. Both the Upstream and Downstream segments of the value chain are supported by Space Agencies, which act as Investors, Insurers, and Regulators.
The downstream space sector
The downstream space sector includes satellite operations, data or signal distribution, and value-adding activities intended to transform or deliver space capacity into useful services and products for end users.
The visibility of satellite technology decreases down the value chain; it becomes merely a component of an integrated solution ("space inside"). While only part of the larger solution, it does remain an essential component in order to ensure service delivery, availability and continuity. As a consequence, the applications and market players in the downstream sector are driven more by the requirements of end users than by specific technological capabilities or limitations of space systems. As a result, the downstream sector is less homogeneous than the upstream and much more complex to analyse.
While certain service providers have opted for a vertically integrated business model, from ownership of the satellite systems to the provision of services to end users, most would rather procure the required capacity externally.
Satellite operators own satellite infrastructure in order to retail capacity to third parties; this capacity is related to communications (bandwidth), observation (imagery), navigation (positioning) or science (data). These satellite operators procure satellite systems and launch services competitively with the objective of rapidly achieving a high return on investment.
Satellite service providers create value by transforming the advantages of satellite technology into cost-effective services for the users. This segment is highly fragmented with thousands of companies providing a diverse array of services (voice, data, broadcasting, geo-information, etc.) to specific end-user markets including transport, engineering, defence, agriculture, media, tourism, consumers, etc. The actors in this segment vary from multi-national corporations addressing mass markets (such as satellite TV broadcasting) to small companies active in professional niche markets.
Terminal suppliers provide remote end-user equipment such as very-small aperture terminals (VSATs) which send and/or receive signals for a variety of applications including television broadcast, data and mobile communications. As prices have trended sharply lower in recent years, terminal manufacturing has increasingly become a low margin business particularly for fixed applications such as DTH television and consumer broadband. Conversely, terminals for niche markets such as satellite news-gathering and mobility (maritime and aeronautical) applications represent lower volumes but offer higher margins.
2.2 Trends and dynamics in the world space industry
The revenues of the space industry worldwide was estimated at US$250 billion in 2013, which included
- US$204 billion for revenues derived from commercial space activities from upstream (e.g. space systems manufacturing) to downstream (e.g. services) activities.
- US$46 billion in revenues derived from government customers (based on the consideration that on average 70% of government budgets are contracted to industry). This includes industry contracts related to government space activities such as space exploration, space science, launch vehicles, manned spaceflight and government satellite missions (Earth observation, satellite communications, satellite navigations etc.).
Figure 4 provides an overview of global commercial space activities (i.e excluding government activities) by value chain on the left and by application, on the right.
Figure 4: World's industry revenues from space activities in 2013
US$204 billion
12%
(last 5 years CAGR)
| SATCOM | SATNAV | EO | |
|---|---|---|---|
| Revenues from commercial market | 66% | 32% | 2% |
US$46 billion
1%
(last 5 years CAGR)
| SATCOM | SATNAV | Other | Launchers | EO & METEO | Manned spaceflight | Science & exploration | |
|---|---|---|---|---|---|---|---|
| Revenues from government market (includes classified and generic technology programs) |
12% | 7% | 22% | 14% | 17% | 18% | 9% |
Source: Euroconsult
Focus on the satellite manufacturing market
As shown in Figure 5 and 6 below, in the past 10 years government and commercial operators lofted 800 satellites with a launch mass over 50 kg into space. From 2014 to 2023, a further 1,155 satellites are expected to be launched that should generate manufacturing revenues of US$188 billion over the decade, growth of 25% compared to the past 10 years. Of these future satellites, 350 will be commercial (over 80% for communications and broadcasting services), representing a manufacturing market of US$56 billion over the ten year forecast period.
The commercial satellite manufacturing market is global, competitive and price intensive. It currently includes approximately 30 Tier 1 companies in a position to assemble, integrate, and test (AIT) complete satellite systems of different capabilities. Fewer than 10 manufacturers compete internationally for commercial GEO communications satellites with historically the four U.S. and two European manufacturers dominating the market with over 80% of combined market share. In addition, the satellite manufacturing industry depends heavily upon governments that support technology development through direct R&D funds or investment that industry can leverage on the commercial market. National public programs have been essential over the years in order to support innovation and competitiveness of their industry, even in the communications market, often perceived as commercially "mature". This is highlighted in Figure 7 that shows the direct relationship between government funding levels and industry market performance: U.S. industry benefits from the world's largest government satellite communications program and European industry enjoys the world's largest civil R&D program dedicated to satellite communications, which in turn explains the performance of these industries in the international commercial market.
Figure 5: World satellites launched by type of operator (2004-2023)
| Past | Forecast | |||||||||||||||||||
|---|---|---|---|---|---|---|---|---|---|---|---|---|---|---|---|---|---|---|---|---|
| 2004 | 2005 | 2006 | 2007 | 2008 | 2009 | 2010 | 2011 | 2012 | 2013 | 2014 | 2015 | 2016 | 2017 | 2018 | 2019 | 2020 | 2021 | 2022 | 2023 | |
| Commercial | 13 | 14 | 19 | 23 | 32 | 22 | 24 | 27 | 22 | 24 | 38 | 52 | 55 | 47 | 25 | 33 | 20 | 28 | 25 | 27 |
| Government | 27 | 34 | 38 | 35 | 31 | 34 | 36 | 52 | 42 | 53 | 62 | 70 | 70 | 66 | 68 | 56 | 56 | 51 | 43 | 53 |
| Military | 19 | 14 | 19 | 30 | 16 | 27 | 24 | 22 | 23 | 21 | 21 | 15 | 18 | 24 | 21 | 27 | 21 | 25 | 20 | 18 |
| General total | 59 | 62 | 76 | 88 | 79 | 83 | 84 | 101 | 87 | 98 | 121 | 137 | 143 | 137 | 114 | 116 | 97 | 104 | 88 | 98 |
Source: Euroconsult
Figure 6: World satellites launched by applications
| Telecom | Earth Observation | Navigation | Technology | Security | Science | Meteorology | Exploration | |
|---|---|---|---|---|---|---|---|---|
| 2004-2013 (Total 817 satellites) |
41% | 21% | 11% | 8% | 6% | 6% | 4% | 2% |
| Telecom | Earth Observation | Navigation | Technology | Security | Science | Meteorology | Exploration | |
|---|---|---|---|---|---|---|---|---|
| 2014-2023 (Total 1.155 satellites) |
41% | 29% | 11% | 2% | 4% | 5% | 6% | 2% |
Source: Euroconsult
Figure 7: Government funding and market shares in satellite communications
(2004-2013)
| US + Europe | Other | |
|---|---|---|
| Government funding | 70% | 30% |
| US + Europe | Other | |
|---|---|---|
| Commercial market share (satellite manufacturing) |
88% | 12% |
Source: Euroconsult
Focus on commercial satellite services markets
Downstream, three value chains have developed for the provision of commercial services derived from satellite systems: communications (Satcom), Earth observation (EO), and navigation (Satnav).
(US$ in billion)
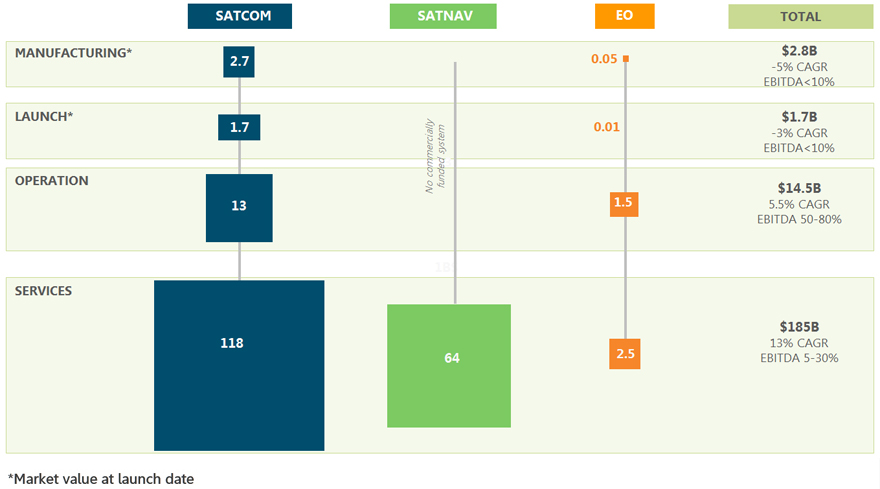
Figure 8 - Text version
| SATCOM | SATNAV | EO | Total | |
|---|---|---|---|---|
| Manufacturing (market value at launch date) |
2.7 | No commercially funded system | 0.05 | $2.8B -5% CAGR EBITDA<10% |
| Launch (market value at launch date) |
1.7 | No commercially funded system | 0.01 | $1.7B -3% CAGR EBITDA<10% |
| Operation | 13 | No commercially funded system | 1.5 | $14.5B 5.5% CAGR EBITDA 50-80% |
| Services | 118 | 64 | 2.5 | $185B 13% CAGR EBITDA 5-30% |
Source: Euroconsult
As shown in Figure 8, communication services are the most developed commercially as the telecommunications and broadcasting industries have used satellite networks extensively for 45 years. Today they generate over 66% of the value of the commercial market.
- Commercial satellite communications operators generated revenues of US$13 billion in 2013. Fixed Satellite Service (FSS) operators own and operate satellites and lease satellite capacity on a wholesale basis to telecommunications operators, broadcasters, internet service providers, VSAT providers, and other service providers for various communications and broadcasting services. As of 2013, 37 FSS satellite operators are active on a national, regional, or global basis around the world. The market is very concentrated, with the top five FSS operators accounting for 70% of 2013 revenues. Mobile Satellite Service (MSS) operators sell or lease satellite capacity in the form of airtime (minutes) or bandwidth (MHz) on a wholesale basis to customers. Five MSS operators were active as of 2013, with historical operator Inmarsat accounting for 62% of total revenues.
- Satellite communication services are quite diverse by nature and are provided by several hundred individual companies, most notably for DTH broadcasting, consumer broadband, enterprise networks, maritime and aeronautical communications. Total 2013 revenues of satellite communication service providers are estimated at US$118 billion, of which 90% come from video services (essentially DTH TV broadcasting). This sector is experiencing increasing vertical integration (operators acquiring service providers) and consolidation as a way to enhance market share or profit margin in a highly competitive environment.
The satellite navigation service market has experienced considerable growth but features a distinct value chain profile due to its lack of commercial upstream infrastructure ownership.
- As current systems are funded and operated directly by government agencies, there are no commercial revenues associated with the manufacturing of satellite navigation systems. Investment in satellite navigation remains highly concentrated in a few countries as the launch cost of a functional system is extremely high. As of 2014, two countries have operational GNSS systems in place: The U.S. with GPS and Russia with Glonass. Europe and China are developing their own GNSS infrastructure (Galileo and Beidou).
- Satellite navigation value-added services have experienced considerable growth over the last decade, providing a large market for equipment (terminals) and service providers. A forecast released by the European Global Navigation Satellite Systems AgencyFootnote 3 indicates that GNSS devices are planned to increase almost four-fold generating a market from around US$2 billion in 2013 to close to US$7 billion in 2022. In addition, the GNSS services market is estimated to double from US$64 billion in 2013 to US$100 billion in 2022. The personal LBS market (primarily smartphones) and road transportation are the two key drivers for the development of commercial services representing collectively over 90% of the market. Agriculture, surveillance, rail, maritime and air transports share the remaining 10% of market value.
Commercial Earth observation remains an emerging market.
- The commercial data market is valued at US$1.5 billion. The sector is highly concentrated as two companies account for over 50% of commercial data sales: DigitalGlobe and Airbus Defence & Space. Along with MDA, the three companies are the only ones with revenues over US$100 million for EO satellite data and services. Defence remains the key driver (59% of the market) as commercial data has helped to fill the gap for defence solutions.
- Earth observation imagery providers distribute data through data distribution and value-added reseller partners. Distributors may have exclusive rights to certain countries/regions for sale, and/or specialize in providing solutions to certain vertical markets. This creates a very fragmented downstream sector, with value-adding activities occurring at multiple levels, for example by operators and then again by specialized companies/research institutes depending on specific end-user needs. Total revenues within value-added services are estimated at US$2.2-2.5 billion in 2013.
As shown in Table 3, the entire satellite service market is experiencing significant technical and business changes that affect supply and demand dynamics.
| Demand dynamics | Competition dynamics |
|---|---|
| Communications | |
|
|
| Navigation | |
|
|
| Observation | |
|
|
The Canadian space sector
1. Government space activities in Canada
1.1 A new policy framework
In 2012, the Government undertook a comprehensive review of Aerospace and Space Programs and Policies. The findings of this Review, referred to as the Emerson report,Footnote 4 led to the release of a new Space Policy Framework in 2014,Footnote 5 which outlines broad national goals for the space program and the creation of a Space Advisory Board to provide expert advice to government on Canada's role and future in space. The five core principles that will inform Canadian space activities as set out in the Space Policy Framework below provide direction on priorities and areas requiring action. In order to implement the new Space Policy Framework, a new approach of multi-stakeholder governance has been established to improve oversight, monitor progress and provide independent views on space programs managed by the Government of Canada.
Canada's Space Policy Framework
Principles
- Canadian Interests First
- Positioning the Private Sector at the Forefront of Space Activities
- Progress Through Partnerships
- Excellence in Key Capabilities
- Inspiring Canadians
Areas for Action
- Commercialization
- Research and Development
- Exploration of Space
Stewardship, Management & Accountability
Source: CSA
In parallel, other strategic initiatives of the government will influence the direction of space activities in Canada. For instance, in December 2014, the government unveiled an updated Science, Technology and Innovation (ST&I) strategyFootnote 6. This new strategy added advanced manufacturing as a new ST&I priority and included automation with robotics, aerospace and nanotechnology as three of sevenFootnote 7 focus areas within advanced manufacturing that are considered strategically important to Canada. Such objectives support and implement space policy principles such as the development of excellence in key capabilities.
DND and Canadian Armed Forces (CAF) have had a space policy since 1992; more recently, a draft National Defence Space Policy and Strategy has been developedFootnote 8 to support the six core mission areas identified in the Canada First Defence Strategy. That new defence space policy reflects the strategic importance of space to the DND/CAF and emphasizes the requirement for Canada to establish a whole-of-government and comprehensive approach, as well as seeking cooperative opportunities with key allies. In reinforcing the idea that assured access to space capabilities is essential for the CAF to successfully conduct operations, it specifies three overarching objectives:
- Deliver and sustain space effects, such as Command, Control, Communications, Computers, Intelligence, Surveillance and ReconnaissanceFootnote 9
- Integrate space effects
- Assure freedom of space operations
1.2 Key departments involved in space activities
The Minister of Industry is responsible for the design and implementation of Canadian space policy and programs which includes the responsibility for the Canadian Space Agency (CSA), as well as other space related organizations in his portfolio, including the Communications Research Centre (CRC) and National Research Council of Canada (NRC).
The CSA acts as the government's lead agency for space, through collaboration with Other Government Departments (OGDs), private organizations, universities and international partners, and is responsible for assisting the Minister in coordinating all federal space-related policies and programs. To support implementation of the Space Policy, the CSA's immediate priorities will be to continue the implementation of government decisions on flagship missions such as the RADARSAT Constellation Mission (RCM) and the International Space Station (ISS) project, where Canada renewed its commitments until 2020. Alongside flagship missions, the CSA will continue to develop Canadian participation in international missions such as the NASA/CNES Surface Water and Ocean Topography (SWOT) mission. Advancing Canada's space capability through investing in early stage technology development, providing flight opportunities and supporting the development of highly qualified personnel (HQP) in areas key to Canada's future are also important priorities for the CSA in the coming five years. Table 4 provides a description of major space projects currently underway.
DND has played an increasing role in the national space program reflecting the enhanced priority given to national security and sovereignty. Defence programs contribute primarily to the objective of meeting Canada's security needs including surveillance and access to secure communications networks through the combination of national and international assets. This led to the establishment of Canada's Director General Space (DG Space). DND has engaged in an ambitious plan, focused on developing capabilities in communications as well as intelligence, surveillance and reconnaissance (ISR), with emphasis on the Arctic and maritime security.
Natural Resource Canada's Remote Sensing Centre (CCRS) and Canadian Space Weather Forecast Centre receive process and disseminate remotely sensed data for Canada and dispatch space weather forecasts.
OGDs have increasingly become involved in space matters, primarily as users and in some cases service providers, such as Environment Canada and Fisheries and Oceans Canada (as more detailed on p.40).
| Government funding | Program name | Application | Features |
|---|---|---|---|
| >$1 billion | International Space Station | Space Science and Exploration (Civil) |
Canadian contribution to the ISS includes, the Space Station Remote Manipulator System, mobile base and the Dextre system. Following completion of the ISS assembly, participants will now be focused on utilization for scientific experiments. Confirmed commitment until 2020. |
| RADARSAT Constellation Mission (RCM) | Earth observation (Dual) |
An evolution of the RADARSAT Program with the objective of ensuring data continuity, improved operational use of Synthetic Aperture Radar (SAR) and Automatic Identification System (AIS). To be launched in 2018. | |
| $500 million to $1 billion |
Protected Milsatcom | Communications (Defence) |
Protected MILSATCOM is the name for Canadian participation to the U.S. Air Force's Advanced Extremely High Frequency (AEHF) system. Agreement covers a 12-year period, through a partnership with the US, U.K., Canada, and the Netherlands. 3 of 6 satellites launched by 2013. |
| $100 million to $500 million | Mercury Global | Communications (Defence) |
The Mercury Global project is the name given to Canada's participation in the US Wideband Global Satellite Communications System (WGS). DND signed an agreement with the US DoD for 20-year access to the WGS System in exchange of funding one satellite of the constellation (6 satellites launched; 4 more satellites to be launched). |
| Polar Epsilon 2 | Earth observation (Defence) |
DND plans to develop infrastructure to permit collection, processing, exploitation and dissemination of RCM SAR and AIS data. To be completed in 2018. | |
| James Webb Telescope | Space science and exploration (Civil) |
U.S. (NASA) led Successor to the Hubble Space Telescope. Fine Guidance Sensor (FGS) and the Near-InfraRed Imager and Slitless Spectrograph (NIRISS). Slated for launch in 2018. | |
| $50 million to $100 million |
SAPPHIRE | Space security (Defence) |
Launched in 2013, Sapphire monitors space objects orbiting between 6,000 and 40,000 kilometres above the Earth's surface on a 24-hour basis. It is Canada's contribution to the international space surveillance system. |
| OSIRIS-Rex | Space science and exploration (Civil) |
U.S (NASA) led mission to return a sample of asteroid Bennu to Earth. Canadian contribution is an OSIRIS-REx Laser Altimeter (OLA). To be launched in 2016. | |
| CASSIOPE | Space science and exploration (Civil) |
First Canadian hybrid satellite to carry a dual mission in the fields of telecommunications and scientific research, particularly space weather. Launched in 2013. | |
| $10 million to $50 million |
NEOSSAT | Space security (Dual) |
The first world's space telescope to detect and track asteroids, space objects and devris. Launched in 2013 and co-funded by CSA and DRDC. |
| >$10 million | Astro-H | Space science and exploration (civil) |
Japanese (JAXA) led mission to study and explore astrophysical objects, the non-thermal universe, the structure of the universe and its evolution. Canadian contribution is the Canadian Astro-H Metrology System (CAMS). To be launched in 2015. |
| M3MSAT | Communications (Dual) |
Mission objective to demonstrate and further develop a multi-mission capability and allow optimization of the AIS payload in maritime traffic identification. To be launched in 2015. |
1.3 Program orientations reflect a selective funding approach
Canadian government expenditures for space result from combined funding in civil programs and spending commitment from DND in space assets. While OGDs incur expenditures for space, it is a challenge to estimate spending levels where the space-based component is integrated into wider operations. As such information is not available for the purpose of this report, CSA investment constitutes the baseline of civil expenditures. DND funding levels for space activities are not public and have been estimated to represent more or less 50% of Canadian government overall space expenditures in 2013.
In 1999 the Government decided to provide the CSA with a stable A‐base of $300 million dollars per year, leaving flexibility to undertake new activities and address program pressures on an ongoing basis. Over the decade to 2009, the Canadian civil space program benefited from this steady funding base level, after which budgets gradually increased to around $400 million in 2014. This increasing budget is a result of various ad hoc allocations for stimulus initiatives, including that for space robotics, as part of Canada's 2009 Economic Action Plan and also RCM funding allocations since 2010. However, as highlighted in Figure 10, these investments are cyclical and mask the fact that since 2012, the baseline CSA budget has seen a downward trajectory with lower funding allocated to civil space activities outside these targeted increased allocations. These large scale projects have taken over a significant percentage of the CSA's spending leaving little of the flexibility that was conceived of back in 1999 when the $300 million baseline funding was established.
Figure 10: Canada civil space budget
1993-2014 (C$ in million)
| 1993 | 1994 | 1995 | 1996 | 1997 | 1998 | 1999 | 2000 | 2001 | 2002 | 2003 | 2004 | 2005 | 2006 | 2007 | 2008 | 2009 | 2010 | 2011 | 2012 | 2013 | 2014 | 2015 | 2016 | 2017 | 2018 | 2019 | |
|---|---|---|---|---|---|---|---|---|---|---|---|---|---|---|---|---|---|---|---|---|---|---|---|---|---|---|---|
| CSA baseline | 310.0 | 320.0 | 300.0 | 300.0 | 300.0 | 300.0 | 300.0 | 300.0 | 300.0 | 300.0 | 300.0 | 300.0 | 290.0 | 260.0 | 260.0 | 260.0 | 260.0 | 260.0 | 260.0 | 260.0 | |||||||
| Total spending (incl. ad hoc activities) | 329.0 | 288.8 | 237.5 | 217.9 | 216.1 | 285.6 | 340.0 | 310.0 | 340.0 | 340.0 | 280.0 | 285.0 | 290.0 | 314.5 | 294.7 | 302.7 | 339.7 | 370.0 | 410.0 | 320.0 | 410.0 | 360.0 | 485.0 | 385.0 | 325.0 | 325.0 | 295.0 |
Source: CSA
Funding patterns reflect the niche strategy to concentrate Canada's efforts in a few strategic space technologies. As such, on average over the past five years earth observation has captured 42% of the CSA's funding allocations, followed by science and exploration (26%) and human spaceflight (18%). Technology and satellite communications received more limited allocations, each representing 10% of the CSA's annual budget (see Figure 11). Therefore Canada tends to dedicate a strong portion of its civil investment to science and technology activities, while Earth observation represents the core focus for satellite applications programs. Several countries that used to have a similar profile of investment decided in the recent years to shift or increase their focus into a wider range of application programs to stimulate commercial opportunities to their industries (such as the UK, Germany or Japan).
Figure 11: Canada civil space spending, breakdown by application 2009-2014
| General budget | Telecom | EO | Space Science & Exploration | Technology | Human Spaceflight | Other | |
|---|---|---|---|---|---|---|---|
| Canada civil space spending, breakdown by application 2009-2014 | 16% | 3% | 35% | 21% | 8% | 15% | 2% |
Source: CSA
1.4 Canada position within global government space activities is declining
The two extra, or ad-hoc, funding in the last five years have enabled to maintain Canadian share in the world's global investment. However, as shown in Figure 12, following the RCM funding commitment Canada's share could significantly drop in the world's considering the evolution of CSA's baseline funding.
Since 2013 Canada has not been one of the top 10 countries in terms of investment, with countries such as the U.K., India and Germany investing into their space programs at a higher pace than Canada. When taking into account civil activities only, Canada dedicates today in absolute terms (i.e. in $ value) a funding level comparable to that of Brazil or South Korea. When looking at national investment efforts as a proportion of the national economy (GDP) or per inhabitant, Canada certainly does not lead the pack and lags behind countries having established, or having the ambition to establish, a certain level of global or regional leadership. In addition, and as shown in Figure 13, Canada's space budget-on-GDP ratio is well under the world's average.
Figure 12: Share of Canadian government civil space investment in world's total
2004-2013 (in %)
| 2004 | 2005 | 2006 | 2007 | 2008 | 2009 | 2010 | 2011 | 2012 | 2013 | |
|---|---|---|---|---|---|---|---|---|---|---|
| CSA Baseline | 0.90% | 0.91% | 0.92% | 0.90% | 0.86% | 0.70% | 0.77% | 0.77% | 0.76% | 0.62% |
| Total Allocations | 0.86% | 0.88% | 0.97% | 0.88% | 0.86% | 0.79% | 0.95% | 1.05% | 0.84% | 0.98% |
Source: Euroconsult
Figure 13: Budget comparision of Canada with the top world 10 space programs
civil programs only (2013)
| USA | RU | FRA | GER | JP | IT | CAN | IND | UK | CHN | World | |
|---|---|---|---|---|---|---|---|---|---|---|---|
| Spending per capita (US$) | 62.462 | 45.348 | 37.957 | 23.069 | 15.368 | 15.001 | 13.444 | 9.434 | 8.768 | 1.000 | 7.289 |
| RU | USA | FRA | IND | GER | CHN | IT | JP | CAN | UK | World | |
|---|---|---|---|---|---|---|---|---|---|---|---|
| Spending on GDP (%) | 0.303 | 0.118 | 0.088 | 0.067 | 0.052 | 0.044 | 0.044 | 0.039 | 0.026 | 0.022 | 0.062 |
Source: Euroconsult
2. The space industry in Canada
2.1 Canadian space sector value chain
The Canadian space sector is comprised of over 200 organizations (including 150 private companies and 50 universities) involved at different levels of the space value chain and employing a total of 9,784 workers involved in a wide array of highly qualified jobs. It is estimated that this sector generated cumulative revenues of $5.37 billion in 2013 when taking into account Canadian satellite broadcasting activities, and $2.63 billion when excluding these activities. These cumulative revenues shall not be understood as representing the consolidated economic value of the Canadian space industry which is the objective of the economic impact valuation discussed in the next chapter of this report; it is however an important economic indicator of the commercial activity from the Canadian space sector.
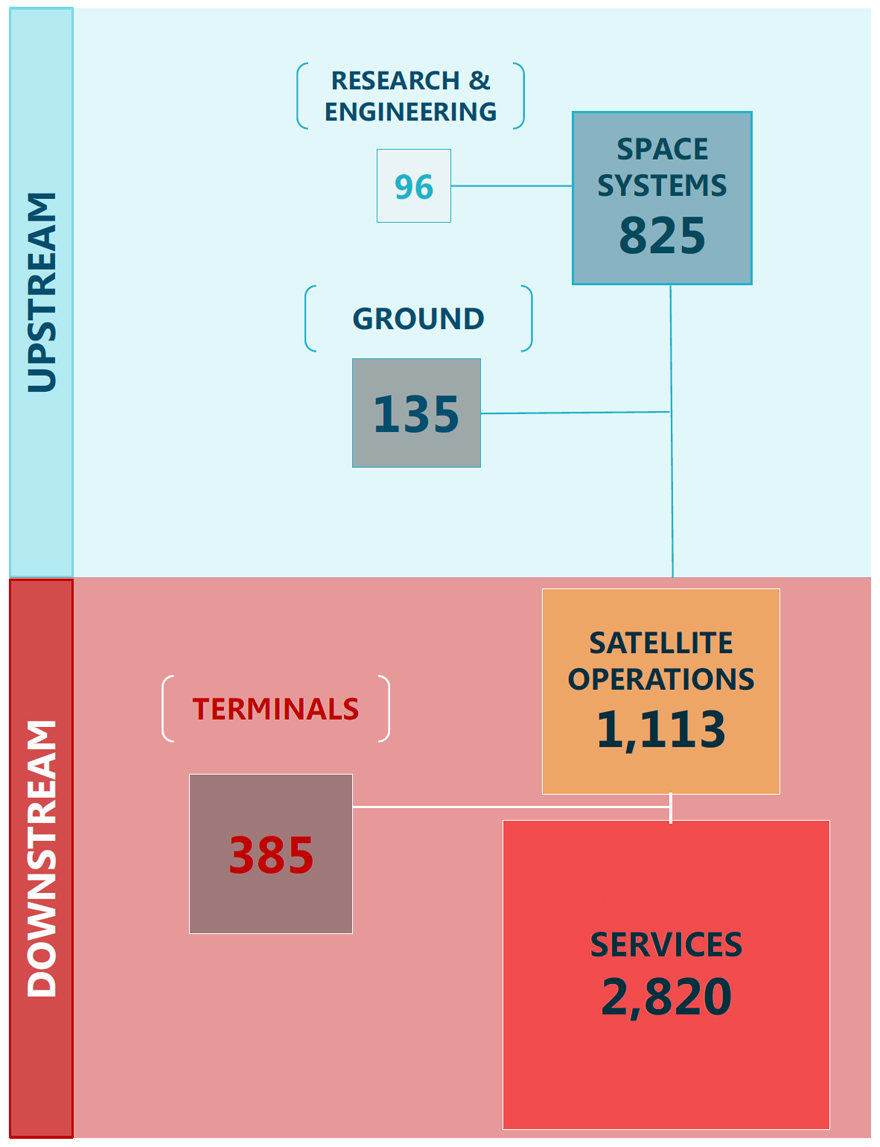
Figure 14 - Text version
The graphic visualization is a series of blocks that represent each segment, with subsequent numbers representing the size of the investment. The Upstream Sector specialized in Space Systems ($825 million), Ground Systems ($135 million), and Research and Engineering ($96 million). The Downstream Sector produced Consumer Services ($2,820 million), Satellite Operations ($1,113 million), and Terminals Systems ($385 million).
Source: CSA, Euroconsult
As shown in Figure 15, in 2013 revenues of the Canadian space industry could be broken down as follows:
- Research and engineering services generated $96 million (1.8% of the total) from 58 companies and 49 universities
- Space systems manufacturing generated $825 million (15.4% of the total) from 35 companies
- Ground systems manufacturing generated $135 million (2.5% of the total) from 16 companies
- Satellite operation generated $1.1 billion (20.7% of the total) from 4 companies
- Terminal suppliers generated $385 million (7.2% of the total) from 16 companies
- Services generated $2.82 billion (52% of the total) from 48 companies; 90% of those revenues were generated by satellite broadcasting activities
No revenues were attributed to launch services as no satellite launch activities take place within Canada.
Figure 15: Three ways to breakdown the Canadian space value chain
| Satellite Operations | Ground Segment | Engineering & Research | Space Systems Manufacturing | Satellite Services | |
|---|---|---|---|---|---|
| By organizations (226) | 2% | 14% | 47% | 16% | 21% |
| Satellite Operations | Ground Segment | Engineering & consulting | Space Systems Manufacturing | Satellite Services | |
|---|---|---|---|---|---|
| By revenues ($5.37B) | 21% | 10% | 2% | 15% | 52% |
| Satellite Operations | Ground Segment | Engineering & Research | Space Systems Manufacturing | Satellite Services | |
|---|---|---|---|---|---|
| By jobs (9784) | 6% | 15% | 14% | 30% | 35% |
Source: CSA, Euroconsult
2.2 Regional footprint of the Canadian space sector
Figure 16 provides a mapping of the Canadian space sector across Canadian regions. Canada's space sector is anchored in Ontario, which accounted for approximately 60% of total revenues and over 55% of employment in 2013. This can be attributed to a strong base of manufacturing, satellite operations and service providers, along with a cluster of universities engaged in space activities. Another hub of space activity is Quebec, which accounted for roughly 20% of revenues and 22% of Canada's space workforce in 2013. Revenues and employment are fairly evenly distributed across other regions, with Alberta leading the way in the Prairies, while Newfoundland and New Brunswick account for the bulk of activities in Atlantic Canada.
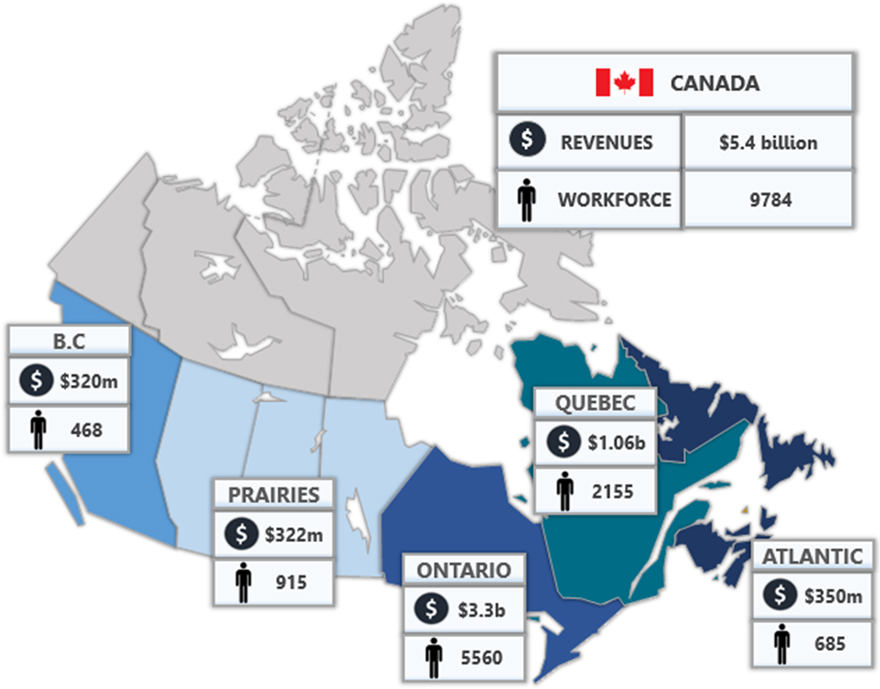
Figure 16 - Text version
| B.C | Prairies | Ontario | Quebec | Atlantic | Canada | |
|---|---|---|---|---|---|---|
| Revenues | $320m | $322m | $3.3b | $1.06b | $350m | $5.4 billion |
| Workforce | 468 | 915 | 5560 | 2155 | 685 | 9784 |
Source: CSA Annual Survey (2013), Euroconsult.
2.3 Structure of the Canadian space sector
Key features of the Canadian space value chain include:
- The Canadian space value chain can be considered as mature. Each segment of the value chain generates greater revenues than the preceding segment (i.e. there is an added value at each step). In that respect, its structure is comparable to that of the world's space value chain. It is worth noting, however, that the service segment is relatively less mature in Canada than globally. Globally, Services generate on average 8 times the revenues as Satellite Operations. This is different in Canada where, revenues in the Services segment generate only twice the revenues in Satellite Operations. This situation is partly due to the presence of a global market leader in the satellite operation segment (Telesat) that generates comparatively high revenues in relation to the service industry.
- The Canadian space industry is highly concentrated in terms of revenues: The 10 largest firms account for almost 90% of total revenues; this ratio is the same whether we include broadcast related revenues or not, and is stable over time (it was equivalent 10 years ago).
- The Canadian space industry is less concentrated in terms of jobs: The 10 largest firms in terms of revenues account for 71% of total employment of the industry.
- Satellite communications is the main driver for the sector's revenues, generating $4.65 billion (upstream and downstream) in 2013, 87% of the total revenue of the industry. Again, the ratio is comparable when excluding satellite broadcasting activities and is stable over time.
- The Canadian space sector relies essentially on export and commercial markets from which respectively 64% and 86% of its revenues are generated when excluding broadcasting services (that focus on domestic services only and would distort the reality of the vast majority of players). These proportions are very stable over time.
The concentration of the Canadian industry and the weight of satellite communications in the industry's revenues result from the presence of companies that have established leadership roles in different segments of the commercial satellite communications market from which they generate significant revenues.
- Regarding space systems, MDA and COM DEV together account for no less than half of the Canadian total revenues in this domain. The two companies have established national leadership and are primary suppliers for satellite payloads, systems and subsystems. Their manufacturing revenues are essentially derived from the international satellite communications business. In 2012, MDA acquired U.S.-based Space System/Loral, the world's leading commercial satellite manufacturer (the revenues of its U.S. subsidiary are not included in this study).
- Regarding satellite operations, Canada is home to the fourth largest Fixed Satellite Service Operator, Telesat, which launched the world's first commercially available GEO satellite (Anik A1 in 1972) and operates 14 satellites as of year-end 2014. In 2013 Telesat posted revenues of $892.8 million for a net profit of $68 million. The satellite operation business is notorious for being capital intensive (considerable expenditures are required to finance the acquisition of satellite assets) and not labour intensive (limited workforce requirements to manage business operations). This explains the relatively low share of jobs compared to their share in the space sector revenues.
- Regarding services, satellite broadcasting accounts for 90% of revenues with three companies (Bell TV, Shaw Direct and XM Sirius Canada) based on Euroconsult estimates. Direct-To-Home (DTH) and satellite radio represent the largest consumer market for the satellite industry generating the most revenues worldwide; in that respect, Canada's market structure is no different from that of other countries.
Outside the top 10 companies, the remaining 104 organizations reporting detailed corporate information represented a total space related revenues of $536 million and 2,967 employees. This makes on average revenue of $5.1 million and 30 employees per organization. The gap between the top 10 and the rest of the industry highlights a somewhat fragile space business for many companies (either SMEs or larger companies but with limited space activity) essentially working for a few customers (often related to government programs) with limited recurring space business and having difficulties to perform on the export market. A large proportion of companies generate small to very small space-related revenues; 50% of companies report below $10 million in revenues for their space activities. The proportion was higher 10 years ago (88%) and about half of the very small companies have not been active in the space business since then.
Figure 17: Distributions of companies by revenues
| >100M$ | 50-100M$ | 10-50M$ | 1-10M$ | <1M$ | |
|---|---|---|---|---|---|
| 2004 | 4.5% | 0.6% | 7.3% | 16.4% | 71.2% |
| 2013 | 4.0% | 2.3% | 4.0% | 20.3% | 32.8% |
Source: CSA, Euroconsult
The Canadian space sector is characterized by the presence of a large number of SMEs (firms with under 500 employees) who account for nearly 90% of all organizations. These SMEs are primarily anchored in the engineering & research and services segments. In terms of manufacturing, SMEs still maintain a considerable presence, which has likely been stimulated by demand from larger upstream integrators or manufacturers. It is important to note that many of the 25 organizations considered to be large enterprises have fewer than 500 employees in Canada; these organizations however are often subsidiaries of large multi-national companies. As such, the organizations have been considered as "non-SMEs" as they are likely to derive benefits in terms of scale, financing and market access from their parent companies or owners
| Value chain segments | Organizations | SMEs (%) |
|---|---|---|
| Engineering & research | 107 | 100% |
| Space systems manufacturing | 35 | 69% |
| Ground systems manufacturing | 16 | 75% |
| Satellite operations | 4 | 50% |
| Terminals manufacturing | 16 | 63% |
| Satellite services | 48 | 90% |
| Total | 226 | 88% |
Source: CSA, Euroconsult
2.4 Dynamics of the Canadian space sector
The Canadian space sector has experienced steady revenue growth during the last 10 years with a Compound Annual Growth Rate (CAGR) of 5.9%, from $3.21 billion in 2004 to $5.37 billion in 2013. Despite a challenging environment including the world economy and national public finances, the Canadian space sector maintained positive growth of 3.7% over the last five years while the Canadian national economy grew by only 1.8% during the same period.Footnote 11 The upstream and downstream sectors display significant differences in their dynamics due to the nature of their business. Furthermore, although the Canadian space sector is highly focused on export and commercial activities, the situation can be quite different depending on companies' positioning in the value chain:
The upstream sector varies substantially by application:
- Manufacturing companies active in the Earth observation or space exploration markets base 60% to 70% of their revenues on Canadian government programs. On the contrary, manufacturing companies active in the satellite communication market generate 95% of their revenues from commercial business.
- The upstream space sector has experienced no or moderate aggregate growth (0% in the last 10 years, 2% in the last 5 years).
The downstream sector is much less homogeneous than the upstream with a large number of small companies involved in a wide range of service-oriented activities.
- The downstream sector generates the majority of the revenues and is also more dynamic. Its share of total revenues in the Canadian space sector has grown over time from 63% in 2004 to 79% in 2013 (this is true even when excluding broadcasting revenues).
- Downstream, companies are more disconnected from Canadian government funding, which accounts for only a marginal portion of their revenues (below 5%). 60% of companies' revenues in the downstream are derived in Canada, essentially from commercial customers (consumers or enterprise). The remaining 40% is generated from exports, here again largely dominated by private sector business.
As shown in Figure 18, key trends by application include:
- Satellite communications (including broadcast) generates most of the Canadian space industry's revenues and is also the most dynamic market.
- Earth observation is the next largest application with 7% of the sector's revenues and positive growth trends thanks to continuous government programs (e.g. RADARSAT) and non-negligible international exports.
- Satellite navigation accounted for 5.2% of the Canadian Space Sector revenues in 2013, essentially related to downstream commercial activities as there is no significant program funded by the Canadian government in this field.
- Applications that largely depend on government investment such as science and exploration have suffered from unstable budgets in the last 10 years with decreasing revenues over time.
Figure 18: Key revenue trends (2004-2013 CAGR)
| Total space sector |
Geographical market |
Client type |
Value chain segment |
Application | ||||||||
|---|---|---|---|---|---|---|---|---|---|---|---|---|
| Exports | Canada | Canadian government |
Commercial | Downstream | Upstream | SATNAV & other |
Earth observation |
Science & exploration |
Broadcast | SATCOM (all) |
||
| 10 year CAGR | 6% | 3% | 7% | 6% | 5% | 8% | 0% | -1% | 6% | -3% | 8% | 7% |
| 5 year CAGR | 4% | 2% | 4% | 4% | 5% | 4% | 2% | -6% | 10% | -5% | 4% | 4% |
Source: CSA, Euroconsult
Figure 19: Revenue trends of the Canadian space sector (CA$ in billion)
by segment
| 2004 | 2005 | 2006 | 2007 | 2008 | 2009 | 2010 | 2011 | 2012 | 2013 | |
|---|---|---|---|---|---|---|---|---|---|---|
| Other Downstream | 0.683 | 0.801 | 0.770 | 0.911 | 1.235 | 1.216 | 1.561 | 1.423 | 1.355 | 1.505 |
| Upstream | 1.171 | 1.085 | 1.080 | 0.769 | 0.866 | 1.034 | 1.073 | 1.232 | 1.127 | 1.122 |
| Broadcast | 3.210 | 3.393 | 3.598 | 3.658 | 4.279 | 4.640 | 5.249 | 5.388, | 5.236 | 5.373 |
Source: CSA, Euroconsult
2.5 Market position of the Canadian commercial space sector
Share of the Canadian space sector in the global space market
Based on the revenues of the Canadian space sector and estimates on global market sizes, the market share of the Canadian space industry in the world market is estimated at 1.96%. This is a good performance when considering that Canadian space program accounts for 0.9% of world's total civil government funding for space activities. The Canadian industry generates its highest market share in the commercial upstream market segment (11%), essentially related to the manufacturing of communication satellites.
| Market segment | Size (US$ in billion, 2013) |
Prev. 5Y CAGR | Next 10Y CAGR (forecast) | Canadian industry share (2013) |
|---|---|---|---|---|
| World government market | 46Footnote 12 | 1% | 1.3% | 0.98%Footnote 13 |
| World commercial market | 204 | 12% | 6.9% | 2.4% |
| Upstream | 5 | -6% | 1.8% | 11% |
| Downstream | 199 | 13% | 7% | 1.9% |
| Total | 250 | 8.9% | 6% | 1.96% |
Source: Euroconsult
Opportunities and challenges for the Canadian space sector
Canada has extensive experience in the development and use of satellite technology and has established a pioneering tradition in this domain:
- First country to operate a commercial domestic satellite (Anik) from geostationary orbit in 1972
- First to deploy a direct-to-home broadcasting service in 1978 with Anik B
- Pioneer in the development of operational SAR satellites
- Longest continuous availability of operational radar satellite data through the RADARSAT series
- First to deploy two-way consumer multimedia communications in the Ka-band (30/20 GHz) in 2004 with Anik F2
- Second worldwide to develop collection and delivery of satellite AIS information.
This experience has been built through a combination of national initiatives developed by the CSA with the support of other government departments and cooperative programs (such as ESA) that directly allowed the emergence of global market leaders in Canada along the value chain, including:
- Space system technologies such as space antennas, space digital electronics design (e.g. MDA), payload products, electronics and instruments (e.g. COMDEV, ABB), and small satellite integration (e.g. Magellan, COMDEV, MDA)
- Ground systems technologies such as radar ground systems (e.g. MDA, SED, Blackbridge) and end users terminals (e.g. Advantech, Polarsat)
- Canada is home to the world's fourth largest FSS operator, Telesat, who has directly benefited from the Anik program legacy; home to the first satellite AIS data provider with exactEarth; and home to a leading commercial SAR-based service provider with MDA GSI (building on the RADARSAT program legacy)
- Further downstream, this investment was leveraged by a myriad of service companies to develop a range of satellite-based solutions for domestic and international customers in fields such as telecommunications, broadcasting, geospatial and geomatics businesses.
Most of this expertise and market leadership finds its roots in government funding from 10 to 20 years ago. More recently, the Canadian space sector has faced major challenges as a result of eroding investments in domains such as satellite communications and space exploration, including the erosion of capabilities, companies exiting the space business, or a weakening of the position of Canadian companies in a tough, globally competitive market. The combination of a difficult national government funding context and a fast growing international market environment generates potential risks for the long run; Canada is no longer in a leadership position in some domains it recently pioneered.
Lack of investment in domains such as satellite navigation has resulted in the quasi absence of a relationship between industry and government organizations. Because Canada does not own satellite navigation assets in-orbit (and uses foreign satellite navigation systems), Canada has dedicated marginal public investment to satellite navigation applications while its national industry has been developing capabilities to serve fast growing national needs (especially downstream).
Program-focused investments such as that with the Canadarm in space exploration and RADARSAT in Earth observation have been critical in the development of key capabilities in specific domains (i.e robotics, SAR imagery) and the generation of commercial opportunities. Nonetheless, this investment strategy has also fostered dependency for a segment of the industry on government-specific requirements and cycles of investments. This also marginalizes non-participating companies in terms of support and capability development.
Many Canadian industry players had to adapt themselves to their competitive environment and make business decisions to secure or reinforce their position. This includes several investment in new technology domains, foreign acquisitions and subsidiaries:
- In 2011, Iunctus Geomatics acquired the assets of the German company RapidEye and formed Blackbridge, an integrated geoinformation supplier. The company is now working on the deployment of the second generation of its satellite constellation.
- In 2012, MDA acquired U.S. manufacturer Space Systems/Loral which dominates the commercial GEO communication satellites market. This acquisition has positioned MDA as the world leader for the manufacturing of communications satellites.
- Leading Canadian space manufacturers including COM DEV, Neptec and MDA, have created international subsidiaries (notably in the UK) in order to diversify funding and R&D sources.
Today many successful Canadian companies focus on the export market which can represent over 90% of their revenues, with little dependency on government R&D or program specifics. While this could be seen as a sign of commercial maturity, this also implies a disconnection between industry and government. In the long term, this could put business sustainability at risk. It may also challenge long term Canadian capabilities that may not be aligned to future national requirements with potential consequences in terms of technological sovereignty.
The economic footprint of the Candian space sector
1. Impact on Canadian economy
While revenues provide an interesting view of the overall size of the space sector, further analysis is required to ascertain the true impact of the Canadian space sector on Canada's national economy.
1.1 Scope of assessment
The contribution to the Canadian national economy has been measured on the basis of three key economic indicators including:
- GDP, which represents the market value of all goods and services produced by space sector firms in Canada over a given period. GDP, a measure of the value-added of an industry or activity, is equal to the aggregate revenues from the sale of goods or services less the cost of materials and services consumed or purchased during the production process (i.e. profits and wages).
- Employment in terms of the number of full-time equivalent (FTE) jobs supported by the sector.
- Government tax revenue - including income taxation on wages, corporate taxation and indirect taxation (such as sales, excise and property taxes).
In order to gauge the space sector's "total impact" in terms of its economic footprint, direct, indirect and induced economic benefits have been assessed using a model based on Statistics Canada's national economic input-output multipliers. The direct benefits measure the impact of the domestic resources deployed by the space sector itself on GDP. Firms in the space sector also contribute to the Canadian economy through supply chain linkages, which generate economic activity in support of the space sector's activities. As such, indirect benefits assess the value-added GDP and workforce generated by the space sector's demand for intermediate products, components and support services. For example, space sector manufacturers support economic activity and employment within sectors such as plastic and metal production which may not otherwise be present in the absence of demand from the space sector. In addition, induced benefits provide an estimate of the domestic production and workforce supported by the spending of wages by employees of the space sector and its supply chain across the broader economy.
1.2 Canadian space sector's contribution to Canadian GDP
In 2013, the Canadian space sector overall contribution to Canada's GDP was nearly $2.9 billion including direct, indirect and induced effects. This represents 0.18% of the Canadian GDP which stood at roughly $1.6 trillion in 2013.Footnote 14
Figure 20: Canadian space sector's total contribution to GDP (2013)
| Direct | Indirect | Induced | |
|---|---|---|---|
| Canadian space sector's total contribution to GDP (2013) ($2.9 Billion) | 54% | 25% | 21% |
Direct impacts
The Canadian space sector's revenues of $5.37 billion in 2013 translate into nearly $1.6 billion of direct contribution to Canada's GDP. This direct contribution to GDP is significantly lower than the aggregate revenues of firms in the space sector's value chain as adjustments were made to account for intermediary inputs in production and to eliminate double-counting of revenues within the industry's supply chain. As shown in Figure 21, value-added service providers, composed of a diverse range of companies using space-derived data and signals to deliver a service, are the largest direct contributors to Canada's GDP accounting for 60% of the sector's impact. While satellite operators generate revenues in excess of $1 billion, their overall contribution to GDP is relatively limited. This is due in part to the fact that their revenues and operating income are largely offset by capital expenditures on imports of intermediary goods (satellites) and the service of import-related debt.
Figure 21: Revenues vs. direct GDP contribution (2013) (%)
| Revenues ($5.3 billion) |
Direct GDP ($1.6 billion) |
|
|---|---|---|
| Value-added services & applications | 59.0% | 60.3% |
| Satellite operations | 20.7% | 5.6% |
| Manufacturing | 18.5% | 28.2% |
| Engineering & Consulting | 1.8% | 6.0% |
Source: CSA, Industry Canada, Euroconsult.
SMEs accounted for an estimated 45% of the space sector's direct contribution to Canada's GDP in 2013. This figure trails the average contribution of SMEs to Canada's GDP, which stood at roughly 54% in 2012, and mirrors the U.S. figure of 45%.Footnote 15 Manufacturers, whether downstream or upstream, are also notable contributors to Canada's GDP, accounting for nearly 30% of the space sector's contribution in 2013. Export markets, particularly for satellite communications, are primary drivers of the activities of space sector manufacturers. While Canadian exports of manufactured goods have fallen over the past decadeFootnote 16, exports in the space sector have grown over the same period, and currently account for over 66% of the revenues of space sector manufacturers.
Indirect and induced impacts
In addition to the direct contributions to Canada's GDP, the Canadian space sector also contributes indirectly to the national economy through its supply chain (indirect) and through the spending of both the space sector's and its supply chain's employees (induced). In 2013, the Canadian space sector's indirect effects on GDP, which represent the economic activity generated in its supply chain, were estimated at roughly $710 million. Induced effects, which represent the contribution to both GDP from employees directly or indirectly supported by the space sector spending their incomes on goods and services across the broader Canadian economy, contributed an additional $600 million to Canada's GDP in 2013. Based on these results, the economic multiplier for Canada's space sector, defined as the total contribution (direct, indirect, and induced) to GDP divided by direct contribution was 1.85 in 2013. This multiplier does not apply to the space sector's aggregate revenues. For comparison purposes, Oxford Economics estimated the multiplier for the U.K. space sector to be roughly 2.0 in 2009, but using revenue as an input, which tends to inflate the result.Footnote 17 The economic multiplier for the manufacturing segment of the Canadian space sector was over 2.0 in 2013, a figure which compares favourably to Canada's aerospace manufacturing sector (roughly 1.95).Footnote 18 Value-added applications and service providers, led by the presence of large satellite TV broadcasters, are responsible for generating over 55% of the space sector's value-added contribution to GDP. Space manufacturing firms are also significant contributors to Canada's economy, accounting for over 30% of the Canadian space sector's contribution to GDP.
1.3 Canadian space sector's contribution to job creation in Canada
When accounting for direct, indirect and induced effects, the Canadian space sector supported a total of roughly 24,500 jobs throughout Canada's economy in 2013.
Figure 22: Canadian space sector's total job creation (2013)
| Direct jobs (40%) |
Indirect jobs (32%) |
Induced jobs (30%) |
|
|---|---|---|---|
| Canadian space sector's job creation | 9,784 | 7,895 | 6,675 |
| Total jobs | 24,354 | ||
Source: CSA, Industry Canada, Statistics Canada, Euroconsult.
Direct impacts
Canada's space sector directly employed 9,784 full-time equivalent (FTE) workers in 2013. Despite a challenging global economic climate and a 9% decrease in 2011, the Canadian space sector has managed to grow nearly six times faster than Canada's overall job growth from 2008 to 2013 (Figure 23). Over the period, space sector employment grew by over 22% compared to just under 4% for Canada as a whole, which is even more impressive considering that Canada's labour market performance has been the strongest of its G-7 peers.Footnote 19
Figure 23: Evolution of space sector vs. Canada employment (2008-2013)
| 2008 | 2009 | 2010 | 2011 | 2012 | 2013 | |
|---|---|---|---|---|---|---|
| Space sector (FTE jobs) | 8,014 | 8,888 | 9,634 | 8,928 | 9,485 | 9,784 |
| 2008 | 2009 | 2010 | 2011 | 2012 | 2013 | |
|---|---|---|---|---|---|---|
| Canada (in thousands (000s)) | 17,087.4 | 16,813.1 | 17,041.0 | 17,306.2 | 17,507.7 | 17,731.2 |
Source: CSA, Statistics Canada, Euroconsult
While value-added service providers, led by the country's satellite TV and radio broadcasters, are the leading employers in Canada's space sector, firms engaged in manufacturing as their primary activity directly support nearly 3,600 jobs, or 35% of the space sector's overall workforce. Universities, which are largely present in the research and engineering segment, are also considerable contributors to space sector employment, supporting over 1,200 FTE jobs in 2013. Canada's space sector is a magnet for highly-qualified personnel (HQP), which include engineers, scientists and technicians (as defined internally by the CSA).Footnote 20 In 2013, highly-qualified personnel accounted for 53% of total space sector employment, up from just 48% in 2008. This preponderance and creation of high quality jobs is an innovation driver within the space sector and widely considered as a key to Canada's long-term economic competitiveness in the global knowledge economy.Footnote 21
Figure 24: Canadian space sector direct employment breakdown (2013)
| Manufacturing | Satellite operations | Value-added services & applications | Engineering & Consulting | |
|---|---|---|---|---|
| By segment (Total: 9784) | 35% | 6% | 45% | 14% |
| Engineers/Scientists | Technicians | Sales & Marketing | Administration | Other | Management | |
|---|---|---|---|---|---|---|
| By type of jobs (Total: 9784) | 35% | 18% | 5% | 27% | 7% | 8% |
Source: CSA Annual Survey (2013)
Combining direct GDP and employment figures for space firms allows for measuring the space sector's labour productivity. With a GDP per worker of roughly $160,000 in 2013, Canada's space sector workforce was over twice as productive as Canada's broader industrial workforce, which averaged just $73,000 of GDP per worker in 2012.Footnote 22
Figure 25: Labour productivity of Canadian space sector
(GDP per worker – 2013 [non-space figures are from 2012])
| Space | Space Manufact. | Canada | All Manufact. | Aerospace | Automotive | Computers & Electronics |
Pharma | |
|---|---|---|---|---|---|---|---|---|
| GDP per worker - 2013 (Non-space figures are from 2012) ($) |
160,000 | 123,000 | 73,000 | 115,000 | 193,000 | 114,000 | 98,000 | 93,000 |
Source: CSA, Industry Canada, Statistics Canada, Euroconsult.
Space sector manufacturers were over 7% more productive given their employment levels in 2013 compared to the aggregate of Canada's manufacturing sectors. With a GDP per worker of roughly $123,000, space manufacturing firms had higher productivity levels than several notable manufacturing sector peers including computers and electronics, pharmaceutical and automotive manufacturing firms. Space manufacturers trailed the productivity levels of the aerospace manufacturing sector, partially attributable to the fact that space firms generally manufacture goods in smaller, less standardized batches than their aerospace peers.
Canada's SMEs are often cited for the country's lower labour productivity levels as compared to the United States. As indicated by Statistics Canada: "The gap between the levels of labour productivity in Canada and the United States is due primarily to the larger share of employment in small firms in Canada and their comparatively lower labour productivity vis-a-vis large firms". Footnote 23 However, the strong presence of SMEs in the Canadian space sector, and its higher than average levels labour productivity, indicate that these firms and the space sector as a whole are making the requisite investments in human capital, research, machinery, equipment and technology.
Indirect and induced impacts
In addition to direct employment, the Canadian space sector supported nearly 7,900 jobs within its supply chain (indirect) and nearly 6,700 jobs throughout the broader Canadian economy (induced). The resulting employment multiplier is nearly 2.5. In other words, for every 1 job directly created by companies in Canada's space sector, 1.5 additional jobs are supported in the sector's supply chain and the broader economy. This figure compares favourably with the Canadian aerospace industry's employment multiplier which was estimated to be roughly 2.35 in 2012.Footnote 24
1.4 Canadian space sector's contribution to government revenues (tax benefit)
In addition to its contributions to GDP and job creation, the Canadian space sector also contributes a significant amount of tax revenues to federal, provincial and municipal government coffers. In 2013, it is estimated that the Canadian space sector directly generated over $487 million in tax revenues across all levels of government. These taxes include direct corporate taxation of profits and income taxes on the wages of the nearly 10,000 space sector employees. A variety of "indirect" taxes which aren't tied to productive activity are also included, such as local property taxes, sales taxes, fuel taxes and import duties paid by the space sector firms or from the purchases made with incomes of direct employees.
Government revenues are also supported by the space sector's indirect and induced economic impacts. The nearly 14,600 jobs generated within the space sector's supply chain and across the broader economy led to an estimated $730 million of personal income in 2013. As such, an estimated $148 million of income taxes were collected. Based on the space sector's indirect and induced impacts on GDP, it is estimated that a further $115 million of indirect taxes were generated.
In total, it is estimated that the space sector contributes approximately $750 million in taxes to government coffers.
| Direct | Indirect | Induced | Total | |
|---|---|---|---|---|
| Contribution to GDP (C$ million) | ||||
| Engineering/consulting services | 95 | 50 | 60 | 205 |
| Manufacturing | 440 | 230 | 220 | 890 |
| Satellite operations | 90 | 40 | 35 | 165 |
| Value-added services & applications | 940 | 390 | 290 | 1,620 |
| Total | 1565 | 710 | 605 | 2,880 |
| Contribution to employment | ||||
| Engineering/consulting services | 1333 | 665 | 760 | 2758 |
| Manufacturing | 3592 | 3060 | 2570 | 9222 |
| Satellite operations | 632 | 470 | 415 | 1517 |
| Value-added services & applications | 4227 | 3700 | 2930 | 10,857 |
| Total | 9784 | 7895 | 6675 | 24,354 |
| Contribution to government revenues (C$ million) | ||||
| Total | 487 | 263 | 750 | |
Source: CSA, Industry Canada, Euroconsult.
2. Efficiency gains and cost savings
As the only truly global solution offering homogenous coverage of the Earth, space technology has demonstrated key competitive advantages and permitted the development of a diversified range of services for government and private sector's end-users. As such, space technology has become a key enabler for a growing number of business operations. As it is difficult to provide an exhaustive and precise quantification of the value of the benefits derived from the development of these services across the country, this section gives an overview of how government and private sectors' players use satellite applications, for which purpose, and with concrete examples of the benefits generated.
2.1 Range of services producing economic gains to end users
As of today, Canadian satellite service providers serve over 1,000 Canadian public and private organizations active in multiple sectors such as natural resources, infrastructure, transportation, defence, utilities, science, health, public safety, financial services, media, telecommunications, engineering and others.
Satellite service providers supply three main categories of services: Imagery, communications and navigation/positioning (Figure 26). The primary benefit of satellite Earth observation is to provide a continuous observation of the Earth to support research or operational activities for government and the private sector activities (such as environment monitoring, agriculture, resource management operations, etc.). Recent innovations in the sector in terms of precision (ground resolution) and time lag (revisit) stimulate the emergence of new applications for a larger range of end-users. Canada is no different from this global context but its specific geography has particularly called for remote sensing solutions; the practicalities to continually monitor wide, remote land areas, extensive borders and coastal zone is often only able to be met with satellite-based solutions. With RADARSAT-2, Canada is one of the main suppliers of operational civilian radar remote sensing data and has developed as a very active community in SAR applications development.
Satellite communications are used to provide connectivity across Canada either as the main network or in complement to terrestrial solutions for both fixed and mobile applications. Due to their broad coverage footprints, satellites have acted as a key enabler for the development of communications services to private enterprises, governments and consumers. Communications satellites are particularly effective at connecting dispersed or remote populations, networks and assets which would be impossible or prohibitively time consuming and costly to connect via a terrestrial alternative. Canada realized very early the benefits offered by satellites to connect the country which led to the launch of Anik A1 in 1972 and more recently of the first Ka-band satellite broadband services with Anik F2. On the maritime side, Canada is one of the world's pioneers using satellite assets to collect Space-based Automatic Identification System (SB-AIS) signals in VHF frequency from vessels. The AIS data provide ship information such as identification, position, course, and speed, etc. which are critical to maritime situational awareness. SB-AIS has helped a number of Canadian governmental and private entities to reinforce their maritime surveillance capability.
The Global Navigation Satellite System (GNSS), such as the U.S. GPS system, provide critical navigation, positioning and timing information to governments, commercial users and consumers across the world. Rapid technological advancements in the sector paired with sharp growth in smartphone penetration have led to the proliferation of GNSS applications generating multiple benefits to end users in terms of time and energy savings, safety and security and efficiency gains. While Canada does not have its own GNSS space infrastructure, its GNSS market is well advanced, with a wide range of civil government, military and commercial users that have adopted GNSS technologies and applications including (amongst others) health services, emergency services, defence, transportation, financial, food production, energy production and environment surveying. The GNSS Coordination Office estimates the direct economic benefits of GPS technology in Canada to be in the range of $6-7 billion and that as much as $100 billion of Canada's GDP may be dependent on GPS.Footnote 25
of space based solutions in Canada
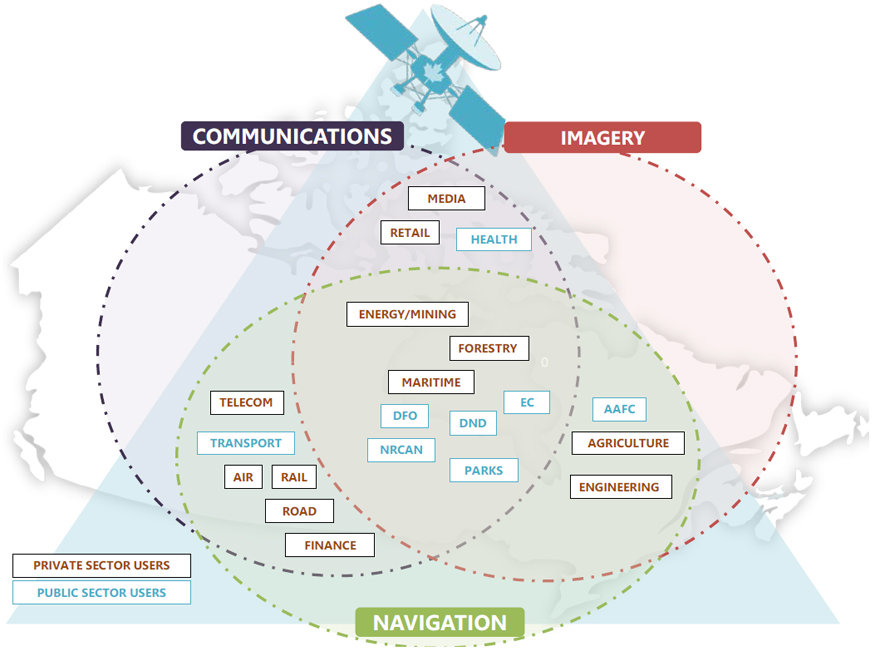
Figure 26 - Text version
The image represented is that of a Venn diagram, with overlapping categories that users are placed into. There are three different segments to end users of space based solutions in Canada, falling under the categories Communications, Imagery, and Navigation. All of these segments contain private users in Energy/Mining, Forestry, and Maritime; and public users in DFO, EC, DND, NRCAN, and Parks. Communications and Navigation share private users in Telecom, Air, Rail, Road, and Finance; with public users in Telecom. Communications and Imagery share private users in Media and Retail, and public users in Health. Finally, Imagery and Navigation have overlapping private users in Agriculture and Engineering, with public users in AAFC. It is important to note that no segment stands alone, and that there is always some interplay between the categories.
2.2 Benefits to government users
The Canadian space program has been tailored to meet the government's strategic priorities including, but not limited to, ensuring national sovereignty and security, linking communities, monitoring natural disasters, managing Canada's natural resources, protecting our environment and the North. Today, space-based solutions form an integral part of the way Canadian government organizations undertake their mandate and pursue these national priorities. The CSA plays a central role within the federal government to consolidate the space-related needs of multiple federal departments, provide cost‐effective space solutions to enhance efficiency and demonstrate new space-based capabilities that support the national interests of Canada.
- Satellite imagery is heavily used by Canadian government departments at both the federal and provincial level, as shown in Figure 27 highlighting data usage within federal government departments. Their requirements vary widely in terms of spatio-temporal resolutions and spectral capabilities and usage include data from Canadian national satellite systems (e.g. RADARSAT), foreign government satellites and commercial solutions.
- Civil government agencies employ satellite communications to provide connectivity to a wide array of government buildings and institutions including schools, hospitals and libraries. In that respect satellites help to bridge the digital divide in order to connect the non or under connected populations, especially in the North where communities are out of reach of terrestrial networks. Civil governments also employ satellite communications to provide connectivity to remote border stations and emergency/disaster response teams. Satellite has become a core part of Defence's communication network providing both fixed and mobile communications capabilities to deployed military troops, assets and communications posts.
- Canadian government departments use foreign satellite navigation systems (e.g. the U.S. GPS system today) to support vital operations in tracking, timing, geomatics, navigation and search and rescue. GNSS has become critical to all aspects of modern military operations whether for precision-guided munitions, navigation, asset tracking or precision timing applications.
Figure 27: Canadian government earth observation data usageFigure 27 note *
(Jul 2008- September 2014)
| RADARSAT | Landsat-series | RADARSAT-2 | ESA missions | Commercial | Other | |
|---|---|---|---|---|---|---|
| By Source (%) | 28% | 23% | 21% | 12% | 8% | 7% |
| EC | FOC | NRCan | DRDC | AAFC | Other | |
|---|---|---|---|---|---|---|
| By End-User (~200k downloads*) | 39% | 21% | 17% | 14% | 5% | 8% |
Figure 27 notes
- Figure 27 note *
-
Data derived from CCMEO statistics of downloaded products for governmental use. Note some government departments (such as DND) have other channels for data inception. Private commercial data providers may also provide further "commercial" solutions.
The following case study provides a concrete example of how a Canadian government organization uses space-derived data and solutions in order to improve its management and regulatory mandate.
Case study #1 The Alberta energy regulator
Mandate
- The Alberta Energy Regulator (AER) ensures the safe, efficient, orderly, and environmentally responsible development of hydrocarbon resources. It includes allocating and conserving water resources, managing public lands, and protecting the environment while providing economic benefits for all in the province
- The AER is responsible for managing Alberta's energy resources in 2013, this equates to established reserves of 1.8 billion barrels of crude oil 167 billion barrels of crude bitumen 33.7 trillion cubic feet of natural gas and 37 billion tons of coal
- The AER regulates over 181 300 wells and 415 000 km of pipelines, 782 gas processing plants in addition to mining sites and processing plants.
- AER is authorized to make decisions on applications for energy development, monitoring for compliance assurance, decommissioning of developments, and all other aspects of energy resource activities. This authority extends to approvals under the public lands and environment statutes that relate to energy resource activities.
- AER uses Earth observation data to better deliver regulatory information on energy activities (exploration, production and site remediation). It support planning, ensures compliance and helps to provide response in case of an incident.
Efficiency gains
- Earth observation data is used to detect and monitor areas of concern, such as surface deformation caused by activities of pumping water into hydrocarbon plays and subsequent extraction.
- Using Landsat-type multispectral data over time also allows to monitor the impact of exploration and production activities (the footprint) on the surrounding areas. As such, imagery plays a critical role in detecting changes to vegetation caused by oil spills. Monitoring of tailings dams to ensure no leakage, or to mitigate against leakage (for instance into other water sources) is another application.
- Using time series data, the start of an oil leak can also be verified. Responders can be guided to where the leak is in order to commence mitigating actions earlier.
- Considering the number of sites in Alberta, imagery is the only feasible mechanism to monitor all sites. It would take significant resources to monitor all well site and activities using staff: particularly those sites in the remote Albertan north. By using imagery, energy industry compliance to regulation can be monitored on a continuous basis without large scale on-site personnel deployments.
- By being able to monitor change, better land/energy management policies can be put in place.
Table 8 provides a detailed review of the usage of satellite applications by federal government agencies. Provincial government users are not listed below but are also key users of satellite technologies for their daily operations (fire departments, police, natural resources management, e-government services, etc.). The section on "social and strategic value" provides further detailed assessment of the Canadian government usage of space-based solutions and their associated benefits.
| Dept. | Main mandate | Examples of satellite enabled activities |
|---|---|---|
| DND | Protect Canada (patrol, monitoring, search & rescue, disaster response). Defend North America Contribute to International Peace and Security (through operations around the world, most often in partnership with allies from other countries). |
Asset/troop tracking – Territory mapping – Maritime domain awareness – Space situational awareness – Border protection and monitoring – Arctic sovereingty – Control of UAVs for ISR- Live video streaming for ISR – Secured tactical comms.– Broadband connectivity for troop welfare – Search & rescue – Voice & data comms. for in-field troops. |
| NRCan | Promote the sustainable development and responsible use of Canada's mineral, energy, and forestry resources. Collect and disseminate knowledge on sustainable resource development. |
Natural disaster monitoring – Ice/snow melt monitoring – Land ecosystem monitoring - Weather monitoring – Mapping – Navigation (charts) –Cadastral/marine surveying – Meteo data transmission |
| AAFC | Provide leadership in the growth and development of a competitive, innovative and sustainable Canadian agriculture and agri-food sector. | Water management – Sustainable agriculture monitoring – Production of crop classification maps – Weather monitoring – Land management |
| EC | Preserve and enhance the quality of the natural environment, including water, air, soil, flora and fauna. Forecast and provision of weather conditions. Coordinate environmental policies and programs for the federal government. |
Weather services – Volcanic ash-cloud monitoring – Sea-ice monitoring – Ice services (tracking/mapping) – Pollution tracking and enforcement – Environmental monitoring – Wildlife tracking/monitoring |
| DFO | Support strong economic growth in Canada's maring and fisheries sector by supporting exports and safe maritime trade. Support innovation in expanding sectors such as aquaculture and biotechnology. Habitat protection, oceans management and ecosystems research. |
Ocean health monitoring – Algae bloom monitoring – Sea surface temperature monitoring – Coastline monitoring –Positioning reports for safety/regulatory compliance – Search & rescue (mapping/comms.) – Vessel tracking/identification. Monitoring of safety/regulatory compliance. |
| Health | Help Canadians maintain and improve their health | Monitoring and forecasting pollution/smog – Ozone profiling –Creation of the Air Quality Health Index (with EC) – Production of daily UV index forecast – Atmospheric composition monitoring |
| Parks Canada | Protect and present nationally significant examples of Canada's natural and cultural heritage. Sustainable development/conservation |
Land-use mapping – Wildlife tracking/monitoring – Internet connectivity for internal applications – Voice & data connectivity in remote regions. |
| Transport | Promote safe and secure transportation systems including air, rail, marine and road. | Ice road monitoring – Water turbidity and sediment loading measurement – Positioning reports for safety/regulatory compliance – Navigation for route optimization – Air traffic control/monitoring – Connectivity for aerial pollution surveillance aircraft – Connectivity for marine pollution patrol vessels. |
2.3 Benefits to private sector users
The Canadian private sector is a well-established user of satellite-based products and services. Two factors in particular have pushed for strong requirements from multiple professional sectors in a wide range of space-based services, including Canada's specific geography and the profile of Canadian business activities. Over a dozen sectors are considered today to be Canada's top business users of space-based solutions. Benefits derived from satellite services are directly related to their business operations, including:
- Monitoring of remote or inaccessible regions in order to improve their business efficiencies or acquire key information for their decision making;
- Ensuring communications during their business operations taking into advantage of satellites' ubiquitous and flexible features; and
- Collecting real-time information to guarantee business safety and/or improve productivity.
The energy sector has the largest requirements for satellite applications across the Canadian industry, As outlined in the following case study, space provides several key benefits to energy and mining companies in terms of efficiency, precision and safety of operations, environmental stewardship and crew (worker) welfare.
Case study #2 Space solutions for the energy and mining sectors
Benefits derived from satellite communications
- Satellite is often the only reliable communications solutions for energy companies to satisfy their ever- growing requirements for applications such as real-time video transmission, seismological and geological data, teleconferencing and crew welfare.
- Satellite communications solutions also help meet the sector's stringent reliability and availability requirements as there are severe opportunity costs when operations must be shut down in the case of a communications systems interruption.
- In order to improve the safety and efficiency of its activities, Canada's Alliance Pipeline automatically gathers 20,000 pieces of data every minute to monitor its 3,700-kilometre-long pipeline running from northeast B.C. to near Chicago.
- Petro Canada relies on satellites to relay key information about production, pressure, temperature and other factors affecting its $2.5-billion development of the Terra Nova oil field, located off the coast of Newfoundland.
- At the Diavik diamond mine, located just 220 kilometers south of the Arctic Circle in the NWT, satellites form the backbone of the mine's communications network, connecting the remote site to Yellowknife. This satellite solution provides the mine with internet connectivity to support its Workplace Learning Centre which enables training and development programs for Diavik's nearly 1000 employees. Satellites are also used to support the mine's construction and operations activities, which have drawn over $6 billion of capital investment to Canada's North over the past 15 years.
Benefits derived from satellite imagery & GNSS
- It is estimated that the energy sector (including mining) represents 44% of private sector's usage of commercial satellite imagery data in Canada, by far the single largest customer group. As a comparison, it accounts for 40% of the private sector market for satellite data worldwide.
- Satellite imagery is used throughout the energy lifecycle from the initial exploration to development and production until decommissioning. It provides critical source of information for a range of applications such as geophysical survey planning, logistics support and monitoring activities.
- In 2014, MDA reported several contracts with customers in the oil and gas, and mining sectors. These contracts includes space-based monitoring services using RADARSAT-2 to support oil exploration and production activities as well as surface movement monitoring products and services that detect and report the extent of surface movement in localized areas.
- Canada's energy sector employs GNSS technology for surveying techniques for exploration deposits (on land and offshore), environmental monitoring and excavation activities, providing superior position accuracy and signal availability, even in deep open pit mines. Integrated on drills to enable ultra-precise positioning of drill holes, GNSS technology is a major factor in optimizing the processing of mined materials.
- Suncor utilizes GNSS technology as a critical input in its tailing reduction operation in Fort McMurray, Alberta which is aimed at reducing the number of tailing ponds and improving tailing pond reclamation over an area spanning millions of square meters. This ultimately helps improve the environmental stewardship of its activities.
Many other industrial sectors use space-based solutions to generate efficiency gains, save costs and improve their overall business operations. Top business end users are outlined below.
- The agriculture/agribusiness industry uses satellite solutions (GPS, satellite imagery) for a number of precision agriculture applications which help to improve yields and efficiency while controlling costs. High resolution satellite data with temporal resolution enables weekly/monthly mapping for change detection, particularly with regards to crop health/yield. For example, the Alberta-based company, BlackBridge, provides satellite services across all major agricultural areas in North America. GNSS technology is used for high precision operations such as auto-steering of equipment and the pinpoint application of chemicals and fertilizers which enables farmers to improve accuracy, reduces overlap, reduces fuel and input usage and maximizes efficiency. By helping optimize productivity and efficiency, GNSS solutions play a key role in improving Canada's competitiveness in the increasingly tech-driven international agriculture industry and building on its position as the fifth largest agricultural exporter in the world.Footnote 26 A recent report published under the federal government's Digital Technology Adoption Pilot Program (DTAPP) concluded that the use of digital technologies, including satellite-based, contributes to cost savings of between 5-10% annually. For a typical farm size of 1,000 to 2,000 acres adopting wireless precision agriculture, the ROIs ranged between one and two years.Footnote 27
- The forestry industry's requirements are similar to those of government (ensuring forest health/sustainability) but more often on a smaller scale (local mapping as opposed to national/provincial). Very high resolution imagery (~10cm) is required for speciation and biomass predications which lend themselves to aerial rather than satellite EO solutions. However, satellite plays a greater role for applications such as wider-area inventorying and reporting on forest health, mapping invasive species infiltrations and forest fire detection. Mobile satellite solutions, including handheld and broadband terminals, are also employed by the forestry industry for providing voice and data communications to and from remote logging sites.
- The engineering and infrastructure industry's use of imagery and GPS is growing in prominence in order to support applications such as cartography, cadaster, urban development, real estate, planning and construction, etc. The sectors together combine nearly 50% of imagery/services use by commercial markets in Canada; for instance to support hydro-electric activities, telecommunications companies (for topographic mapping) and for monitoring large scale infrastructure projects and facilities. GNSS solutions enable hydrographic surveys for marine infrastructure projects to enable precise placement of materials and structures. The sector also utilizes GPS timing capabilities to synchronize power grids and for the precise timing of electrical anomalies in order to determine the exact location of line breaks to shorten the length of outages. Machine-to-machine (M2M) satellite services have been employed in Canada by utilities such as Hydro-Quebec to connect rural "smart meter" collection points which relay data from the province's 3.8 million smart meters. M2M satellite solutions are employed in the construction and engineering industries to track how and where heavy equipment is operating in remote areas, helping prevent theft and indicating when preventative maintenance may be needed. Workers in remote regions utilize mobile satellite services such as satellite phones and mobile broadband terminals for voice and data communications with head offices.
- Retailers across Canada utilize satellite to connect dispersed locations to enterprise resource planning (ERP) networks, for business continuity (backup) applications and to broadcast advertising content to all stores simultaneously. For example, at Walmart Canada locations, store level information is immediately collected and transmitted to its head office to be analyzed and integrated into a voluminous database through a global satellite system. This wealth of real-time business intelligence data from cash registers and distribution centers is regarded as a key to Walmart's vaunted inventory management system.Footnote 28 The relative independence of satellites from terrestrial networks can also help retailers avoid the opportunity costs associated with disruptions to communications networks. For example, during Calgary's historic floods of 2013, both power and internet services were interrupted across the city. In response, a gas station retailer rolled out satellite communications solutions to five of its locations in the most adversely affected regions. This satellite connectivity helped bring the retailer's point-of-sales system back online within just eight hours of the outage, effectively mitigating over $1 million of potential lost revenues during the week before terrestrial communications services were re-established.
- Canada's financial sector utilizes satellites in a similar fashion to retailers, relying on satellite communications systems to connect remote branch locations and ATMs to their network and to ensure continuity of business in the case of interruptions to primary terrestrial connectivity systems. As such, satellites help extend the availability of financial services to traditionally underserved regions and communities. Members of Canada's banking sector use GPS to obtain precise time for their internal clocks and to timestamp the large volume of financial transactions handled by their networks. The financial sector is also using Earth observation to support insurance claims (such as for the agriculture or forestry industry following a disaster event); and in support of commodities/trading, for instance in being able to be predict energy requirements, crops yields, etc.
- Media and telecom benefit from Canada's satellite infrastructure to distribute their programming to pay-TV platforms across the country, whether satellite-based or terrestrial. Canada's satellite pay-TV providers combined carry over 1,200 channels (excluding radio) in 2013, helping to entertain, educate, inform and unite Canadians across the country, while also supporting the national broadcasting industry. For telecom operators, while Canada's cellular and internet service providers tend to favour a mix of fibre and wireless microwave, satellites are employed to provide connections for the backhaul of communications traffic from remote communities where low populations and harsh environments have led to a lack of terrestrial alternatives, particularly in Canada's North. For example, SSi Micro has built an extensive satellite network across the NWT and Nunavut with infrastructure in over 50 communities in locations characterized by extreme weather and fly-in access. Cellular providers use GPS time to synchronize their base stations. The media provides weather services through numerous formats (internet, TV, radio) for both population and industry usage, such as for severe weather warnings and for now/forecasting.
- The Air transportation industry is a heavy user of satellite solutions. GNSS is tightly integrated in the avionics systems of commercial and high-end business aircraft across Canada or through panel-mounted displays for regional and general aviation users. The precision of GNSS solutions helps to increase safety, reduce congestion, save fuel, protect the environment, reduce infrastructure operating costs, and maintain reliable all-weather operations, even at the most challenging airports. In addition, the aviation industry has growing demand for satellite enabled communications solutions driven by growing passengers' expectations of anytime/anywhere connectivity. For example, in 2014 WestJet announced an investment plan to add a satellite connectivity solution for live TV streaming and Wi-Fi connectivity to its entire fleet, which handled over 18.5 million passengers in 2013.Footnote 29 With 75% of these passengers already bringing their own-web enabled devices on-board, this satellite-based internet connectivity service will help differentiate WestJet from its competitors while improving the productivity and entertainment options of its passengers. Tailored weather services also support air transportation logistics, provide storm warnings, etc. The Volcanic Ash Advisory Centre (of Meteorology Canada) for instance monitored the fall-out of the Iceland Volcano incident in 2010 in order to advise regulatory authorities and commercial airlines on safe travel corridors.
- GNSS figures prominently in Canada's rail transportation network, which handles the fourth largest volume of goods in the world, as driver advisory systems designed to improve comfort and safety and optimize overall performance are being fitted to many trains. Positioning information is routinely fed back to train operators to provide them with input for operations management. Passenger trains benefit from GNSS as Via Rail has greatly improved its operations through precise and automated GPS-enabled real-time statistics for each train, as opposed to the previous system that relied primarily on manual time entries to record arrival and departure times. Satellite also form part of Via Rail Canada's hybrid Wi-Fi solution available on trains running between Windsor, Toronto, Ottawa, Montreal, and Quebec City corridor.Footnote 30 Over the most recent Labor Day weekend alone, nearly 62,000 passengers travelled the corridor with Via Rail. A large number of these passengers utilized the satellite-enabled Wi-Fi network, visiting the equivalent of over 2.4 million websites.
- Maritime transportation is growing rapidly in Canada which is no surprise given the fact that Canada has the longest coastline in the world and is home to one of the world's busiest maritime industries with 18 major international ports handling 310 million tons of cargo annually.Footnote 31 Shipping companies have growing requirements for satellite communications regarding reliability and data rates to support operations and crew welfare especially when considering increasing maritime traffic in the Arctic where there is limited available connectivity. A Canadian shipping company reported to have spent $2,500 a month per ship for their satellite communications with growing needs for real time connectivity to support operations. Canada's maritime transportation industry was an early adopter of GPS and remains an extensive user. Today GNSS solutions are employed to report and track vessel position for safety and commercial purposes. There is also increased reliance on GNSS for precision navigation and as an input for traffic management and bridge systems. The sector also benefits from the provision of services from the Canadian Ice Services, for instance provision of regular updates to sea-ice mapping, iceberg detection plus wider meteorology ocean (MetOcean) products such as marine forecasts, wave models etc. Such services use a combination of geostationary and polar-orbiting weather satellites and SAR data for ice mapping.
- Finally, the road transportation or "trucking" industry, employing over 400,000 Canadians, is one of the largest beneficiaries of GNSS solutions which help to overcome some of the challenges on the road such as rising congestion, pollution, and costs of fuel and insurance. Both GNSS and M2M satellite technologies are increasingly being integrated with enterprise resource planning (ERP) software solutions designed to improve the operational efficiency and performance of trucking fleets. These satellite enabled "fleet tracking" solutions enable transportation and distribution companies to instantly access and analyze a wealth of operational data such as fuel consumption, time driven, container location, and refrigeration system and engine performance. The ubiquity of satellite coverage offers a key benefit compared to terrestrial solutions.
| Sector | Sector GDPFootnote 32 (2013) in billion CAD |
Examples of satellite-enabled activities |
|---|---|---|
| EnergyFootnote 33/mining | $170 | Surface geology – base mapping – offshore exploration - operation monitoring – real time information gathering - planning and tactical operations – hazard emergency management – crew welfare – teleconferencing – ERP – real-time video transmission – excavation/drilling activities |
| Agriculture/ agribusiness | $110 | Precision agriculture - Crop health monitoring - Yield forecasts - Storm damage assessment - Asset tracking/guidance - Mapping |
| Forestry | $19.8 | Invasive species monitoring - Seasonal harvest mapping - Forest fire detection and mitigation – Surveying/Inventorying – forest classification mapping – mobile voice & data communications |
| Engineering | N/A | Base mapping - Pipeline planning - Surveying – Planning – site monitoring |
| Retail | $85.8 | Point of sales system connectivity – ERP – videoconferencing – business continuity |
| Financial services | $112 | Commodities indexing - ATM connectivity - Business continuity - support to insurance - |
| Broadcasting (TV/radio) |
$4.2 | Weather information - Broadcast of TV and radio channels - up-link of live news/sporting events - Content distribution to cable head-ends – timing for radio signals |
| Telecom | $31.8 | Base mapping - Backhaul and trunking of data traffic to terrestrial networks – network synchronization |
| Air transportation | $6.1 | Airport flight simulation – safety regulatory compliance - flight tracking/remote surveillance – Navigation - Air traffic management - In-flight entertainment |
| Rail | $6.1 | Passenger broadband connectivity – navigation |
| Maritime | $1.5 | Vessel tracking/identification - safety/regulatory compliance - crew welfare – navigation – provision of MetOcean products (sea conditions) – sea-ice mapping – iceberg detection |
3. Support to innovation
3.1 Spin-ins
The space sector is a large consumer of technologies developed by other industries
The high technological nature of the space industry has been commented on and measured multiple times. Because of the unique environment in which they operate, space products are intrinsically technologically complex, requiring an elaborate production process. The space sector relies on a wide range of technologies, equipment and products, implying technology transfer mechanisms between space and non-space companies and sectors. This is true not only for technologies but also for industrial processes (design, test, assembly, data management, etc.). The space sector supplies new technologies and processes to other sectors (spin-off, next section); it also consumes other sector technologies and processes (spin-in). Both aspects are equally important.
Outside the domains that are specific for its operations (such as propulsion, power or robotics for example), the space sector does not fund many generic technologies, tending instead to focus on their adaptation and customization for space. The space sector procures equipment and products that already exist in other industries and ensures their customization to space requirements, integrating them into space, ground or launch systems. The space sector is also risk averse and is often reluctant to use technologies that are not "flight proven" due to risks associated with the specific nature of the space environment, the fact that space assets are due for long term operations without the possibility to repair after launch. In that respect, government programs are key for testing and qualifying technologies before their full integration into commercial products. This creates significant effects and externalities for supplying industries.
The Canadian space sector is formed by multiple connected industries
This situation explains the wide diversity of the industries connected to the space sector. Canada is not an exception, as its space industry involves a strong proportion of companies from other sectors supplying their products. Only a marginal number of Canadian companies could be considered today as pure players in space, i.e. having space as their main sector of activity. A significant number of companies that form the core of the Canadian space sector derive their products from another lead business, examples including:
- Several global aerospace industry players conduct space-related business activities, including manufacturing. For example, Magellan Aerospace has leveraged its heritage and expertise in aerospace structure and component manufacturing to support space-related activities including sub-orbital rockets, space payloads and small satellites. Other leading aerospace firms with space activities in Canada include Lockheed Martin, Honeywell, IMP and Airbus.
- ABB, a world leader in power and automation technologies, is one of Canada's leaders in space-based optical sensors for atmospheric and weather applications.
- While INO has developed advanced optical and photonic solutions for the space sector, the company counts clients of all descriptions in nearly every field of industrial activity including the aeronautics, agri-food, defence, energy, film, mining, medical and transportation sectors.
- Deltion Innovations, a spin-off from the Northern Centre for Advanced Technology (NORCAT), specializes in transferring and adapting technologies developed in the terrestrial mining market to the space sector and vice versa.
- DRS technologies, a U.S.-based defence contractor and subsidiary of Italian industrial conglomerate Finmeccanica, integrates and manufactures communications components and systems for defence and space applications.
- Excelitas, a manufacturer of high quality electronic and lighting systems, is a leading supplier of space vehicle lighting systems for interior, payload and navigation requirements.
A very high portion of the space sector's value is directly brought by these connected industries. As previously discussed, doing business in the space sector is very demanding. The adaptation of terrestrial technologies for use in space creates a positive feedback loop which in turn improves terrestrial products – giving companies a competitive edge. In other words, the space component of their business drives company-wide innovation. The diversity of the Canadian space manufacturing industry alone is illustrated in Figure 28. For the approximately 10 Tier 1 companies, another 55 companies are estimated to be Tier 2 suppliers and over 200 Tier 3 suppliers, all in all active in well over 20 distinct sectors or industries.
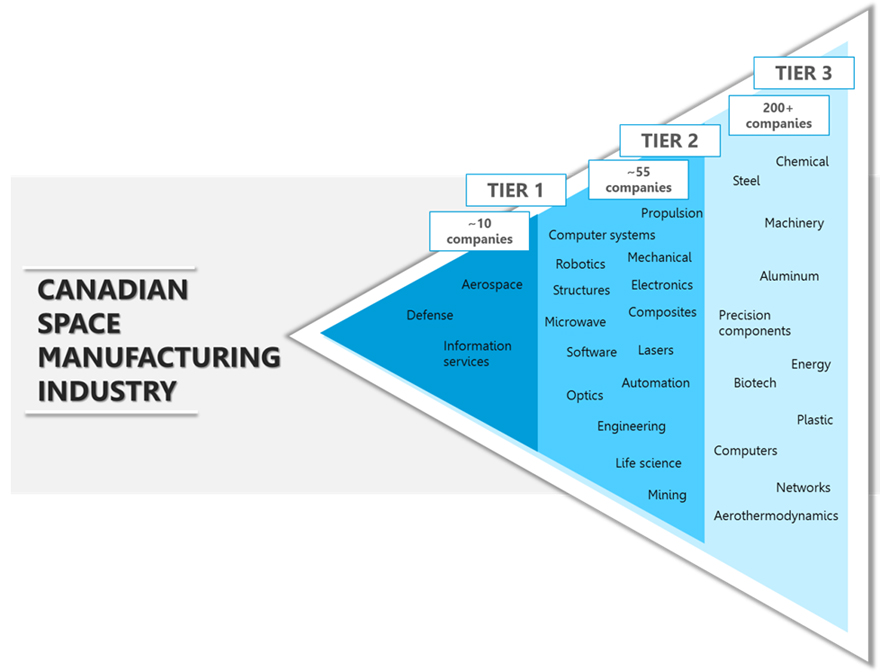
Figure 28 - Text version
The infographic presented is that of a sideways triangle, with vertically sliced sections to display the influence of each tier of manufacturing. The graphic has the widest base against the right of the page and expands, pointing towards the center. The base begins with Tier 3, which includes 200+ companies dealing in: chemical, steel, machinery, aluminum, precision components, energy, biotech, plastic, computers, networks, and aerothermodynamics. Tier 2 moves to the left up the triangle, includes approximately 55 companies and includes: propulsion, computer systems, robotics structures, mechanical, electronics, microwaves, composites, lasers, software, automation, optics, engineering, life science, and mining. The final Tier 1 is represented by approximately 10 companies and specializes in aerospace, defense, and information services.
Spin-in impacts for supplying industries
The use of technologies and processes developed by other sectors into the space sector generates direct effects on supplying industries, whether they supply generic components and products or more specialized equipment or systems (such as scientific instrumentation or on board electronics). One of the key benefits often reported by companies relates to the quality and reliability of technologies developed for space. Indeed, the space industry formulates very high requirements for their suppliers: On schedule, proven long-time reliability, very high quality, cost effectiveness, etc. The implementation of the unique quality standards of the space sector stimulates best practices across the suppliers' businesses. In addition, space is often considered as a strong vector for corporate communications, marketing and human resource management. It enables supplying companies to showcase the quality of their products, publicize on very visible and international projects and motivate their engineering team. In this regard, ABB Canada provides an illustrative case of the tangible benefits derived by a company bringing its technologies into space activities.
Case study #3 ABB Canada's space activities and related benefits
Space activites
- ABB Canada is a leader in power transmission and distribution. It employs approximately 5,000 people in Canada in over 50 locations and is active in over 100 countries.
- The majority of ABB's space business is located in Quebec as part of the Measurements sub-unit in the Process Automation Division. The division equips various industries with technologies and engineering help to stream-line industrial processes.
- Space-related activities now account for 25-35% of the division's business which employs around 250 employees.
- ABB leveraged the technological maturity of its non-space products to consciously diversify its business to supply optical Instruments for space applications such as atmospheric science, environment monitoring, weather forecasting and astronomy. ABB's space products and technologies include: optical instruments, hyperspectral imagers, flight calibration devices, optical ground support equipment, software simulators and data analysis.
- ABB has supplied key components to Canadian and international prime contractors for various space missions for NASA, NOAA, JAXA, ESA and the CSA, amongst others.
Benefits derived
ABB has reported its space activities have produced significant benefits that are diffused throughout other segments and divisions of its Canadian business, including;
- Quality/Reliability: ABB's space-related products are crafted to meet high systems reliability and quality standards. These features form a key part of ABB's value proposition for sales efforts in its traditional business markets.
- Visibility/Marketing: ABB's presence in the space sector has been promoted both in the company's internal and external communications, helping to cement its positioning as a technologically advanced leader in its field. ABB's space segment made top level news throughout the company's global business even though only a small portion of ABB's 150,000 worldwide employees work on space business.
- Motivation: Space is well integrated within the Automation division. A large portion of the engineering staff work on space projects in addition to other domains which helps to motivate the teams due to the high profile of space projects. This is a key impact in supporting the recruitment and retention of top-tier talent.
- New business: CSA funding led directly to export contracts. The company reported to leverage close to five time an initial contract value in additional export revenues. However, it also report increasing competitive pressure on those international export programs.
A key lesson learned shared by primes and their suppliers is that companies supplying products to the space sector must have a solid, demonstrated technology basis before entering the space business. In other words, any company must have a strong core business first, and must have imported its expertise as part of a diversification strategy. But doing business in space also brings challenges, especially for medium-small companies working on a low volume of space-related activities. The cost of technology adaptation to requirements versus low volume and limited long term business predictability can make space business unsustainable for the smallest suppliers. This is particularly true in Canada as industry players often relate the lack of "critical mass" of activities making them vulnerable to the constancy and the frequency of contracts. Such constraints have already pushed several Canadian companies to exit the space business, or to undertake measures to reduce operations. This situation creates a risk for Canada to lose key capabilities if government programs do not ensure a long term R&D baseline to support a sustainable Canadian ecosystem for space. Table 10 demonstrates the multitude of suppliers in the value-chain involved in the development of space capacity with two leading Canadian space sector manufacturers.
| COMDEV | Magellan | |
|---|---|---|
| Number of suppliers | 30 | 10 |
| Type of suppliers | Machine shops, electronic equipment, optics and sensors | Electrical and mechanical equipment/parts, advanced composites |
| Example of spin-in | Inputs from a variety of technology domains, marketing strategies, standards and processes. | Spin-in processes from the aerospace sector include the Foreign Object and Debris Process (FOD) adapted for spacecraft manufacturing; 5S (Sort, Straighten, Shine, Standardize and Sustain) process adapted from Boeing |
3.2 Spin-offs
Spin-offs in the space sector
Spin-off can be defined as any product or development derived incidentally from the application of existing knowledge or enterprise.Footnote 34 In the business community, it would refer to a company whose business is based on products or technology initially developed in a parent company, university or research institution.Footnote 35 Over recent years, the space community has made increasing reference to spin-offs (also called or integrated into the notions of technology transfer, externalities or spillovers) to demonstrate how technologies developed for space-based activities can generate new products or solutions to other sectors of the economy.
Space agencies differ with regards to the emphasis placed on official programs to develop these new products. Two well-known examples of spin-off development are NASA and ESA. NASA has certainly been the most active in publicizing spin-offs from its programs. A NASA spinoff is a technology, originally developed to meet NASA mission needs, which has been transferred to the public and now provides benefits for the U.S. and the world as a commercial product or service. These spin-offs are transferred to the public through various partnerships with industry or other government agencies. Under the Space Technology Directorate, the Partnership Development and Strategic Integration activities managed by the Partnerships, Innovation and Commercial Space (PICS) and the Strategic Integration (SI) offices are responsible for technology transfer and commercialization, interagency coordination and joint activities, intellectual property management, and partnership opportunities with other government agencies and commercial industry. With a budget of $19.5 million in 2012, this represents 0.11% of the overall NASA budget. As a result, since 1976 NASA has reported over 1,800 spin-off technologies from which resulting commercialization has contributed to products and services in the fields of health and medicine, transportation, public safety, consumer goods, energy and environment, information technology, and industrial productivity.Footnote 36 Well known examples include freeze dried food, memory foam used today in mattresses and pillows and scratch resistant glasses. Concurrently, with funding of US$271 million in 2012 representing 1.5% of the overall NASA budget, support programs for technology transfer such as the Small Business Innovative Research and Small Business Technology Transfer Programs seek to provide opportunities for small businesses to develop technologies that have significant potential for commercialization, increasing overall spin-off technologies developed through the NASA space program.
The Technology Transfer Program managed by the ESA Technology Transfer Programme Office (TTPO) promotes and facilitates the diffusion of technologies developed for the ESA space program in other sectors. Transfers include for example air purification systems in hospital intensive care wards, radar surveying of tunnel rock to improve the safety of miners, and enhanced materials for a wide variety of sporting products from racing yachts to running shoes.Footnote 37 Alongside these technology transfer promotion efforts, and with an annual budget of approximately €4.5 million representing 0.11% of the annual ESA budget, the dedicated ESA TTPO also supports business incubation facilities across several locations, a technology transfer network, and provides investment support to entrepreneurs, start-ups and other European businesses.
Spin-offs from the Canadian space program
The CSA Intellectual Property and Technology Transfer Office is responsible for facilitating the transfer of intellectual property associated with technologies developed in the course of CSA activities for commercial and R&D purpose. The Intellectual Property and Technology Transfer (IPTT) office operates with an annual budget of $300,000 per year, representing 0.08% of the total CSA budget in 2012, which is lower but overall comparable to the share of ESA and NASA budget dedicated to similar activities. The CSA IPTT office manages 93 active technologies, 67 trade secrets, 26 technologies that are patented in various countries (82 patents) and 33 official marks (protected in Canada only). From those technologies, 29 are licensed to industry or academia.
Figure 29: Part of budget allocated to technology transfer activities
NASA, ESA, CSA (2012)
| NASA | ESA | CSA | |
|---|---|---|---|
| Technology transfer budget (% total) | 0.108% | 0.106% | 0.078% |
Source: NASA, ESA, CSA, Euroconsult
In addition, CSA's Advanced Exploration Technology Development (AETD) program promotes innovation through its objective to increase space technology to new applications. According to the CSA Evaluation of the AETD program,Footnote 38 approximately 65% of AETD contract recipients reported that their organizations have transferred AETD-based solutions to new or improved applications between 2008 and 2013. Among these contract recipients, 87% transferred between one and three solutions to new and improved applications, for a total of 38 applications among 23 AETD contract recipients. A non-exhaustive list of terrestrial applications developed is highlighted in Table 11.
| Initial technology developed | Adapted application |
|---|---|
| Fuel Cell technology developed for planetary rovers | Adapted for use on submarines and airplanes |
| Medical interface used in space | Adapted to perform ultrasounds in remote areas |
| Vision systems developed for planetary rovers | Adapted for use as laser sensors for navigating mines and as a guidance systems for helicopter landing |
| Robotics developed for orbital servicing | Adapted for use as medical applications, including neurosurgery and breast cancer screening and automation for use as nuclear solutions |
Source: CSA
Spillovers generated by CSA contracts
A recent analysis conducted by HEC Montreal on the spillovers associated with CSA contracts concluded that on average for each dollar invested, another $1.2 in spillovers were created.Footnote 3 In other words, for $357 million invested by the CSA, the Canadian space industry generated an additional $408 million for the Canadian economy. These spillovers were the result of reputational or networking benefits of working on space projects, the sale of products based on CSA contracts, or organizational/production improvements at the firm level due to experience working on space-related contracts.
| Number of projects | 103 |
|---|---|
| Total value | $357M |
| Average value per project | $3.46M |
| Average multiplier per project | 0.99 |
| Weighted average multiplier per project | 2.20 |
| Total value of spillovers | $408M |
Source: HEC
Key results from the assessment of the CSA's contract spin-offs include:
- 30% of contracts generated spillovers
- 70% of spillovers are related to exports, meaning that contracts generated export opportunities for contractors
- The downstream sector shows a higher success rate in terms of spillovers but with a lower average weighted multiplier compared to the upstream sector.
- The more commercially oriented a segment, the more spillover value it generates; satellite communications and to a lesser extent Earth observation show the highest spillover returns as firms are able to quickly leverage initial government spending.
- In the space exploration sector, government funding is essential in order to maintain and develop technologies and products, however the possibility to generate commercial spin-offs is more limited or takes more time than that of other sectors. Following funding from programs such as STDP and AETD, companies such as INO, Ontario Drive and Gear and Neptec Design have created new companies or commercialized new products. One of the most well-known Canadian space spin-offs is the NeuroArm, a medical device used for surgery which was developed on the basis of the MDA built Canadarm. The case study below provides another illustration of such spin-offs benefits derived from space exploration activities.
Case study #4 Neptec Technologies spin-off
Neptec space based activities
- Headquartered in Ottawa, with other locations in Texas and Oxford (England), Neptec Design Group (Neptec) was founded in 1990, and specializes in development, integration and support of intelligent sensors and payloads for the space market.
- As NASA prime contractor since 1995, Neptec has developed systems that have flown on over 40 shuttle missions, including the Laser Camera System, TriDAR Autonomous Rendez-vous & Docking Sensor and Space Vision System.
- Historically, NASA made up more than 80% of the company's revenues, but many contracts concluded after the shuttle's retirement and the agency's portion of Neptec's business fell.
- Neptec R&D activities in machine vision solutions have yielded a portfolio of patents and proprietary technologies that include 3D sensors, 3D image processing algorithms, software and robotic designs.
The spin-off
- Founded in 2011, Neptec Technologies was spun-off from Neptec Design Group as part of a diversification strategy to commercialize space-derived technologies including OPAL (Obscurant Penetrating Auto-synchronous LiDAR) sensors and 3DRi software.
- Neptec Technologies' products have been adapted to serve terrestrial applications, offering real-time 3D vision and data acquisition capabilities for machine automation and robotics applications in harsh environments.
- Trimble and Peck Tech Consulting both integrate Neptec's scanners and software with geospatial and information management solutions in the mining sector.
- Neptec's commercial sensor products feature the capability to scan and acquire data through total darkness, dust, snow, rain and fog with high resilience to shocks and vibrations. These benefits are key enablers for mining and oil & gas companies whose exploration and production activities are carried out in remote and challenging regions.
- Looking forward, Neptec Technologies and the Neptec Design Group will continue to benefit from two-way intellectual property and R&D
3.3 Private sector R&D
R&D contributes to innovation in the national economy
While industrial R&D spending accounts for the private sector's investment in the development of new ideas, technologies, and processes to promote businessFootnote 39, R&D intensity, expressed as a percentage of GDP, reflects a nation's or economic sector's relative degree of investment in generating new knowledge.Footnote 40
Private sector R&D investment generates multiple tangible and intangible economic benefits including, but not limited to, developing and improving technologies and products, advancing processes and more generally improving the quality of life of the population. Canada is known for having little industrial R&D investment in relation to comparable economically developed nations. Canada's private sector tends to invest a smaller part of their revenues in R&D, leading to a low R&D intensity; the ratio is considered to be half of that of the U.S. and in 2009 Canada ranked 18th amongst OECD countries.Footnote 41 According to Statistics Canada, the private sector invested $15.5 billion in R&D in 2012, resulting in a low level of R&D intensity of 0.89% (the average of OECD countries being 1.6%). This low level of investment suggests that R&D is not the principal strategy adopted by the bulk Canadian firmsFootnote 42, with the exception of a few industry sectors that drive R&D in the country. In particular, the aerospace sector has been identified as one of the top sectors driving business R&D in Canada, accounting with five other sectors for half of the total Canadian private R&D effort.
The Canadian space sector is an R&D intensive industry
In that context, the Canadian space sector exhibits a high level of performance compared to other national industries. Its overall industry's R&D investment in 2013 is estimated at $179.9 million, including roughly one third coming from their own funds and two thirds from government sources. This corresponds to an R&D intensity of 11% as of the sectors' GDP impact, and 3.3% as of its revenues, which is much higher than other national industries and compares positively to observations in the space sector outside Canada: In 2009, the U.K. space sector reported a 2.2% ratio on revenue and 4.7% on its GDP (but three quarters funded by the companies' own resources).Footnote 43
Figure 30: R&D expenditures by the Canadian space sector (2013)
| Upstream | Downstream | |
|---|---|---|
| By value chain ($180M) | 68% | 32% |
| SATCOM | EO | SATNAV | Other | |
|---|---|---|---|---|
| By application ($180M) | 60% | 19% | 16% | 5% |
Source: CSA
The upstream space sector invested $123 million in R&D in 2013, 68% of the total, resulting in a very high R&D intensity of 23% of its GDP value and 11% of its cumulated revenue, which illustrates the technology-driven nature of the manufacturing business of space systems, especially compared to the national average. Again, Canada ranks highly against other space industries, including world leaders. The European space sector (defined as upstream only) reported a ratio on turnover of 10% in 2011 (two thirds being related to government funding sources, i.e. similar to Canada), which is half of the ratio showed by the Canadian space sector upstream.Footnote 44 As a market where Canadian firms must continuously improve the cost effectiveness and performance of their products in a globally competitive environment, satellite communications drives Canadian space related R&D accounting for nearly 60% of the total, due in part to its relatively larger scale than other applications. Earth observation follows with 19%.
3.4 Science and research activities
A vibrant Canadian space research community
Canada's Science and Technology PolicyFootnote 45 highlights the essential nature of science and technology to Canada's long-term prosperity and Canadian's quality of life. Canadian space research facilities and researchers continue to position Canada as a leading contributor to the global objective of knowledge generation and dissemination. As of 2013, close to 50 research institutions and universities in all provinces (except Prince Edward Island) were engaged in space-related studies in the science, engineering, policy and legal fields. Ontario and Quebec are home to by far the most research institutes focused on space-related activity and receive substantially the most funding. The research undertaken ranges on diverse phenomena from planetary and atmospheric science to the processing of hyperspectral remote sensing and development of nano and micro satellite technologies. While planetary science appears to be the most established scientific discipline, with all provinces having one or more institutions undertaking research in this area, scientific breakthroughs have been discovered in a variety of domains in Canada, as highlighted in Table 13.
| Province | # Research institutes/universities | Selected govt funding | Major scientific disciplines |
|---|---|---|---|
| Alberta | 4 | $48,572,357 | Earth Observation, Planetary Science, Earth-Space Technology |
| British Columbia | 3 | $ 26, 956, 563 | Life Sciences, Astronomy, Space Psychology |
| Manitoba | 2 | $6,513,671 | Climate Science, Planetary Science |
| New Brunswick | 3 | $3,174,604 | Planetary Science |
| Newfoundland | 1 | $839, 905 | Planetary Science |
| Nova Scotia | 6 | $8, 226, 158 | Atmospheric Science, Planetary Science, Earth Observation |
| Ontario | 16 | $142, 793, 383 | Robotics, Life Science, Planetary Science, Geomatics, Space System Design |
| Quebec | 11 | $71,265,128 | Earth Observation, Robotics, Planetary Science, Atmospheric Science |
| Saskatchewan | 2 | $1,592,408 | Planetary Science, Life Science |
Source: CSA
Through increased investments in the federal granting councils (the Canadian Institutes of Health Research, the Natural Sciences and Engineering Research Council, the Social Sciences and Humanities Research Council and the Canada Foundation for Innovation (CFI), Canadian research institutions are positioned to contribute to a greater understanding of our world and to national and global space missions that have led to new discoveries. This is achieved through investment in world-class equipment and facilities such as the Athabasca University Geophysical Observatory II, a leading-edge facility dedicated to studying the aurora and its underlying solar-terrestrial origins, and the University of Toronto's Space Flight Laboratory, a recognised leader in micro/nano satellite technology. Through the granting councils (in 2013) and the CFI (since 1998), Canada has invested over $300 million in developing the infrastructure and research chairs necessary to support Canadian contributions toward knowledge generation in the space sector and the general goal to maintain its position in the knowledge economy.Footnote 46
In addition, the CSA provides financial support to organizations to conduct space-related knowledge development and innovation in CSA priority areas. Its Class Grant and Contribution Program provides financial aid in the form of a non-refundable contribution. From fiscal year 2009-10 to 2013-2014, a total of 195 grants and contributions were allocated through the research component of the program, representing a total funding of $36.2 million over the period.Footnote 47 Objectives of the program include:
- To support the development of science and technology relevant to the priorities of the CSA;
- To foster the continuing development of a critical mass of researchers and highly qualified people in Canada in areas relevant to the priorities of the CSA;
- To support information-gathering, studies and research related to space;
- To increase awareness of Canadian space science and technology among Canadian youth and educators and their participation in related activities;
- To provide learning opportunities to Canadian students and physicians in various space-related disciplines; and
- To support the operations of organizations dedicated to space research and education.
A driver for knowledge creation
The main emphasis of the Canadian space science program during the last decade has been on forefront questions relating to the science of the Earth's surface, atmosphere, ionosphere and magnetosphere, as well as on Mars and asteroids. As such, though science missions have been smaller, they have involved unique concepts and implementation providing new knowledge in critical areas such as upper atmospheric winds, stratospheric constituents, ozone aerosols, ion outflow, variability of stars, and surface composition of Mars. Footnote 48
Collaboration in space science through participation in international missions gives Canadian researchers and institutions greater opportunity to contribute to global objectives, given limited Canadian-led mission opportunities. Science and technology policy objectives can be met through great partnership opportunities where Canada has maximum visibility. For example, in 2008 the Canadian Science Team led by York University that participated in the NASA Phoenix mission discovered snowfall on Mars, which showcased Canada's ability to contribute to scientific discoveries of global impact (see case study next page).Footnote 49
High profile science missions such as this greatly influence Canada's International profile and Canadian sense of achievement. Thomson Reuters data indicates that Canada's world share of research in space science actually rose from 4% to 7% in 2009-2013, pointing to a rising status in the astrophysics field.Footnote 50 This is evidenced by the increased status of Canadian researchers globally. For instance, University of British Columbia cosmologists are rated among the top 1% of the world's most influential sources in the field of space science as ranked by Thomson Reuters' Highly Cited Researchers listing in 2014.Footnote 51
Case study #5 Canadian contribution to the NASA Phoenix mission
The mission : Phoenix
- The Phoenix Lander descended on Mars in 2008 to study the history of water in the Martian arctic and to search for evidence of a habitable zone and assess the biological potential of the ice-soil boundary.
- Phoenix was a multi-agency project led by NASA JPL and the University of Arizona, with contributions from the CSA, industry players such as MDA and a number of universities from across North America and Europe.
- Canada's contributions included the Meteorological Station (MET) provided by the CSA. Using a laser instrument (LIDAR), and a suite of temperature, wind and pressure sensors, the MET tracked daily weather patterns and seasonal climate changes on Mars.
- $37 million funding from the CSA.
- The Canadian Science Team (comprised of members from York, Alberta and Dalhousie Universities, NRCan, Optech Inc., Passat Ltd. and MDA) led the conceptual design, characterization, testing and implementation of the instruments.
- It was the first time the LIDAR technology was applied on the surface of another planet.
Mission benefits
- By scanning and probing the Martian polar sky in such detail from the ground for the first time, Canadian researchers saw a variety of atmospheric activity in greater detail than ever before.
- Researchers are still using this unique data from the Martian polar region to create a clearer picture of how water cycles between surface ice and vapor in the atmosphere.
- The most significant result from the LIDAR observations was the discovery that water ice crystals grow large enough to precipitate significant distances through the atmosphere of Mars: Popularly described as "Snowfall on Mars!" This was not suspected before the mission.
- Findings helped advance the discussion of whether or not there was or ever could be life on Mars.
- Canadian instruments have led to at least 21 separate peer reviewed articles in scientific journals and over 50 papers presented at international conferences.
- The project created an opportunity to demonstrate Canadian expertise and ability to contribute to global science objectives.
Canadian space-based scientific publications
This publication record has great benefits for Canada both in terms of inspiring Canadians through highlighting Canada's ability to produce knowledge and in the increased international perception of Canada as a knowledge producing economy, inviting international partnership opportunities. Assessment of research accomplishments are most often based in part on the number and quality of publications produced over a specific time frame, as well as the journals in which they are published. An exhaustive assessment of Canadian publications in space-related scientific disciplines is not available and would be very difficult to conduct. However, a selective assessment has been recently conducted on behalf of the CSA covering 2,507 publications by Canadian authors/institutions between 2003 and 2012 in Earth observation, space medicine/life sciences and space robotics.Footnote 52 Accounting for 6.9% of the world's total, Canadian research is globally ranked 6th, 3rd and 3rd respectively by amount of publications in these three areas of research. This research is also cited more than the world's average in high impact journals, receiving 9,904 citations. Key findings from this assessment include:
- 92% of these highlighted publications are related to Earth observation, which account for 6.7% of the world's activities in this domain.
- If life science and robotics represent a limited portion of the total (5% and 3% each), they do account for a significant share of the world's total publications (8% and 9.4% respectively).
- With 76% of the highlighted publications from universities, the Universities of British Columbia, Toronto and Calgary are among the most active.
- While peer reviewed publications from industrial actors are more rare, with a focus more on conference participation as a mechanism to disseminate knowledge, MDA is one of the strongest contributors to published Canadian space research.
- NRCan, Environment Canada and Fisheries and Oceans Canada were particularly active in Earth observation research with over 900 publications between 2003 and 2012.
Figure 31: Space related scientific publications in three select disciplines published
in Canada (2003-2012)
| 2003 | 2004 | 2005 | 2006 | 2007 | 2008 | 2009 | 2010 | 2011 | 2012 | |
|---|---|---|---|---|---|---|---|---|---|---|
| Total number | 156 | 218 | 231 | 195 | 228 | 301 | 246 | 286 | 311 | 335 |
| Earth Observation | Life Science | Robotics | |
|---|---|---|---|
| Breakdown by discipline | 92% | 5% | 3% |
Source: Polytechnique
The strategic and social value of the Canadian space sector
1. Support to national security and sovereignty
Alouette-1's objective was to conduct research in order to improve long range communications for the military; since then space has been a key enabler for the military, and today the Canadian defence and security community is the most mature and operational user of space-based solutions across government agencies. As part of its missions, objectives and strategies, DND has been increasingly involved in Canada's national space program. DND, in cooperation with DRDC, CSA, CRC and other Federal agencies, has engaged in an ambitious development plan of its space-based capabilities, aimed at supporting domains such as maritime domain awareness, Arctic sovereignty and overseas international operations.
1.1 Supporting space-based capabilities
Satellite imagery
The defence and security community is the first operational user of satellite imagery in Canada directly supporting areas of sovereignty, maritime security and disaster management activities. The Polar Epsilon project is the cornerstone of DND's development of satellite imagery capabilities. It has as an objective to improve Canada's Arctic and maritime surveillance capabilities using RADARSAT-2 data, as well as meeting the Canadian Armed Forces' requirements for overseas activities. The project implies an investment of C$64.5 million from DND for the construction of a ground segment and centres to process data and imagery provided by RADARSAT-2. In 2013, MDA signed contracts with DND to support ground stations at Masstown, Nova Scotia and Aldergrove, British Columbia.
Polar Epsilon 2 will increase DND's capabilities using RCM data through increased data capacity and revisit time, enabling it to satisfy multiple user requirements. The involvement of DND in the RCM project, and requirements for secure missions planning and acquisition, infers a more dual-use approach to RCM with respect to the previous RADARSAT series missions.
Canadian Armed Forces also rely on the provision of EO data to support intelligence, surveillance and reconnaissance (ISR) activities. The Unclassified Remote-sensing Situational Awareness (URSA) capability for instance will allow Canadian Armed Forces to download unclassified imagery to support in-field operations. The availability of this data will bring a significant contribution to operations supported by Canada.
Satellite communications
Satellites have progressively become an integral part of the military's modern communications infrastructure given the increasingly network-centric nature of modern warfare, where information superiority is imperative. Forecasts indicate that Canadian Armed Forces could be spending upwards of $100 million per year on commercial satellite bandwidth by 2022.Footnote 53 DND has no proprietary military satellite systems but has made the choice to sign strategic partnerships to secure privileged access to allied satellite communications systems. In 2012 DND signed an agreement with the U.S. Department of Defense (DoD) for 20 year's access to the Wideband Global Satellite (WGS) System that offers secure X/Ka-band links designed particularly to support mobile platforms, with multiple spot beams delivering up to 400 Mbps to individual terminals. Other partners in the US WGS program include Denmark, Luxembourg, the Netherlands, New Zealand, and Australia, each nation having guaranteed access to independent communications channels. DND has contributed $337 million for construction of the ninth satellite (of the 10 satellite program) as well as operational support costs. Canada is expected to build up to three permanent ground stations for access to the communications system.
DND also participates in the U.S. Advanced Extremely High Frequency (AEHF) program that provides even more secure and survivable communications, in particular highly secured, jam-proof communications to support nuclear forces and tactical users. Canada funds the third of the six satellite series operated by the U.S. Air Force and launched in 2013. Canadian access to the system is initially for a 12-year period (the U.K. and the Netherlands are also partners in the program). DND agreed to spend a total of $551 million on the program, including approximately $300 million for the ground segment, acquired through the U.S. Foreign Military Sales (FMS) process. These partnerships provide DND with access to superior global satellite communications capabilities to support engagements in conflicts worldwide.
Space-based AIS
In order to support its maritime surveillance activities, DND is developing one of the world's most elaborate space-based AIS tracking systems to identify and locate navigating vessels. The International Maritime Organization's Safety of Life at Sea (SOLAS) convention requires that all passenger ships and those with 300+ gross tonnage carry an AIS tracker to enable their identification. As of today, DND uses commercial AIS data provided by exactEarth, a subsidiary of COM DEV and the world leader in this market.
DND supports the development of M3MSat (Maritime Monitoring and Messaging Micro-Satellite) mission, a joint mission with CSA and manufactured by COM DEV, to enhance the collection of AIS data and to integrate that information with other satellite data to help identify vessels of interest. The system will be supported by an instrument called a Low Data Rate Service (LDRS), which transmits AIS messages to ground sensors. The M3MSat microsatellite will be used to receive and locate digital signals transmitted by vessels. This data will be sent to ground stations to then be relayed to operators for DRDC, making it possible to identify and record marine traffic, know vessels' direction and cruising speed and ensure that they navigate legally and safely in Canadian waters. M3MSat will contribute AIS data which can be fused with RADARSAT 2 SAR data for Maritime Domain Awareness. An integrated AIS sensor is planned to be placed on board RCM which will then have the ability to collect and decode AIS transmissions in cluttered ship environments.
exactEarth has obtain the licence from DND to commercialize AIS data collected from M3MSat and integrate this data with data collected from other exactEarth satellites.
Space surveillance
DND is also endowing demonstration funding for wider security applications. This includes the NEOSSat mission, a joint project with the CSA and DRDC to detect and track asteroids and space objects, and the first dedicated defence satellite, Sapphire, for space surveillance - both launched in 2013. Sapphire identifies and catalogues resident space objects (RSOs), plot their orbit and their trajectory. It also identifies de-orbiting spacecraft, providing warnings to prevent the triggering of false alarms in Canadian and allied radar warning systems. Sapphire was built by MDA, who also operate and maintain the Sapphire System for five years following system commissioning, relay assigned tasking from DND to the satellite, process the collected information, and send the data to the Sensor System Operations Centre (SSOC) operated by DND. Sapphire is contributing to the U.S. Space Surveillance Network.
GNSS
DND has integrated GNSS solutions into all branches of the Canadian Armed Forces. For Canadian soldiers, vehicles, marine vessels or aircraft deployed in the field, accurate positioning and timing information is critical to operations. Specific applications include navigation of unfamiliar terrain, navigation of UAVs, reconnaissance planning and mapping of hostile territory. If Canada does not operate its own GNSS infrastructure, DND's NAVigation WARfare program (NAVWAR) aims to protect GPS-based navigation, guidance and communication resources employed by Canadian armed forces. NAVWAR seeks to improve and integrate the Canadian Armed Forces' GNSS and navigation warfare capabilities to ensure interoperability of information and equipment with Canada's allies. Geospatial positioning data used from GNSS, the U.S. NAVSAT system, is the primary asset used by Canadian military operations.
Figure 32 details the development of DND's major dedicated military space-based infrastructure projects.
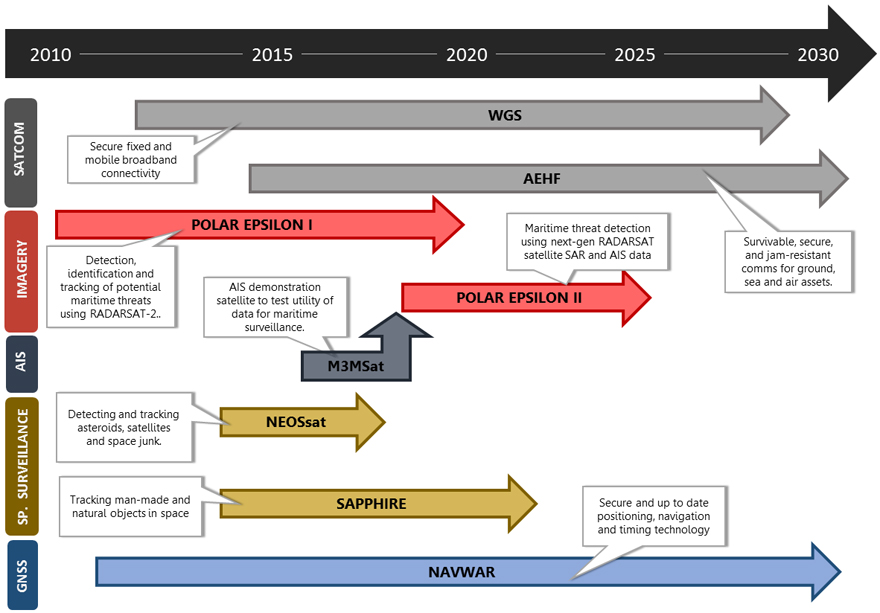
Figure 32 - Text version
The visualization is that of a series of timelines from 2010 to 2030, representing the developing infrastructure in each area of dedication. Information follows:
SATCOM is the first category and includes a timeline for Mercury Global starting in approximately 2012, which aims to secure fixed and mobile broadband connectivity. The next timeline is that of Protected MILSATCOM, which begins in 2015 and is a survivable, secure, and jam-resistant comms for ground, sea and air assets. Imagery is the second category and includes a timeline for Polar Epsilon 1, from 2010 to 2020 and is responsible for detection, identification and tracking of potential maritime threats using RADARSAT-2. Polar Epsilon 2 is beginning around 2018 and is designed for maritime threat detection using next-gen RADARSAT satellite SAR and AIS data. AIS is the third category and has a timeline for M3MSat, which will run from about 2016 to 2018 and is an AIS demonstration satellite to test utility of data for maritime surveillance. The fourth category is SP. Surveillance, which begins with a NEOSat timeline from 2014 to 2017. The satellite is responsible for detecting and tracking asteroids, satellites, and space junk. The SAPPHIRE satellite is going to begin in 2014 and run until 2022 and will track man-made and natural objects in space. The final category is GNSS positioning system and will be enacted in 2011 and run beyond 2030. The purpose of the satellite is to provide secure and up to date positioning, navigation and timing technology for users.
1.2 Benefits and outcomes
Improved maritime domain awareness
Canada has the longest coastline in the world and a marine area of responsibility of over 11 million square kilometers. On any given day there may be 1,700 ships within this area. This maritime environment places significant responsibility on the Government of Canada regarding the monitoring of illegal criminal activity, ship tracking, law enforcement, protection against severe weather and ice events, search and rescue and more broadly to preserve national security and sovereignty.
DND has been working on the use of space-based sensors for maritime domain awareness since 2003 with the objective to develop space-based SAR ship detection applications, AIS processing as well as a fusion of SAR and AIS data (to identify ships and cross them with those carrying an AIS is order to identify alien vessels). The goal is to use satellite assets to identify and potentially intercept illegal or alien activities along Canadian coastal lines.
- Polar Epsilon provides DND with rapid maritime domain awareness ship positioning. Using RADARSAT 2 data, vessel traffic in and near Canadian waters is detected, classified and tracked to better enable the identification of vessels of interest. The data is integrated into a Recognized Maritime Picture (RMP) and shared across other maritime security stakeholders. With an imagery product file delivered in under 15 minutes, DND benefits from near real time ship detection and maritime satellite surveillance. DND has also been able to more effectively deploy its fleet of CP140 aircraft as a result of the use of RADARSAT data to more precisely identify areas of interest, in lieu of surveillance over areas of empty open ocean. It has estimated that this has resulted in a reduction of approximately 60% in required CP140 flights.Footnote 54
- Polar Epsilon 2 will considerably expand DND's capabilities in maritime domain awareness thanks to an integrated radar and AIS space segment brought with RCM. It will provide the capability for global ship identification and tracking (with global coverage data in less than three hours), coverage of the Arctic four times daily and daily coverage of Continental Ocean Approaches. Integrated SAR and AIS capabilities will allow the tagging non-compliant ships, focusing on vessels with abnormal behaviour which will result in more efficient intelligence and law enforcement activities from Canadian defence and security agencies.
- The Canadian Coast Guard's Marine Communications and Traffic Services (MCTS) program collects and disseminates information that facilitates marine transportation based on space assets. Vessels are required to contact the specific MCTS centers using satellite communications to fulfil their reporting requirements prior to entering Canadian waters. The screening of vessels is done though data exchange on the vessel traffic management information system and shared with TC and other government departments.
The improved maritime surveillance capability allowed Canada to play a key role in the multi-national "Operation Driftnet" maritime operation which monitored illegal fishing in the north-west Pacific Ocean. Operation DRIFTNET is a recurring Canadian Armed Forces operation conducted in support of Fisheries and Oceans Canada. It delivers Canada's participation in multinational efforts to control drift netting and other forms of illegal, unregulated and unreported fishing in the North Pacific Ocean. The mission and its related outcomes are detailed in the case study below.
Case study #6 Operation Driftnet
Mission background
- High-seas drift-netting is an environmentally destructive fishing practice that has been under global moratorium through U.N. General Assembly resolution since 1992.
- Driftnet fishing is a technique that uses vast panels of netting, typically 10 to 15 meters wide and up to 20 kilometers long that are fitted with floats and weights so they hang in the water to entangle fish and other wildlife.
- Traditionally made of materials that allowed small species and young fish to escape, modern driftnets are made of tightly woven synthetic materials, such as nylon monofilament. As such, in addition to their intended catch of such species as salmon, tuna and swordfish, modern driftnets ensnare marine mammals, birds and turtles in numbers, along with significant quantities of fish of unmarketable maturity, size or species.
- Between 1989 and 1991, the U.N. General Assembly made three increasingly stringent resolutions on driftnet fishing. The last of the series called on all members of the international community to implement a global moratorium on large-scale pelagic driftnet fishing in international waters by 31 December 1992 and banned nets more than 2.5 kilometers in length.
- As part of Operation Driftnet, member nations of the North Pacific Anadromous Fish Commission (NPAFC), including Canada, Japan, the Russian Federation, South Korea, the United States and China (cooperating non-party member), work to detect and apprehend vessels involved in illegal, unreported and unregulated fishing in the North Pacific.
Canada's contribution & impacts
- First patrols of Operation DRIFTNET were flown in 1993.
- Canada's contribution to Operation DRIFTNET is a task force composed of the long-range patrol squadrons of the Royal Canadian Air Force and their CP-140 Aurora maritime patrol aircraft. Using the Aurora's enhanced electronic sensor suite, the Fishery Officers and the Aurora operators look for signs of illegal fishing and gather imagery for use as evidence in enforcement action. Satellite links are used for communications and real-time transmission of data.
- Operation DRIFTNET is supported by RADARSAT-2 satellite imagery and other intelligence compiled with the support of the Canadian Armed Forces and the Department of National Defence's Polar Epsilon Project.
- Operation DRIFTNET is an important component of Canada's contribution to the NPAFC. More than four million square kilometers of the North Pacific Ocean are monitored every year, with patrols taking place throughout spring, summer and fall. When illegal activity by a vessel is confirmed by a patrol, the ship's flag is identified and the vessel's nation is responsible for prosecuting the violator.
- Operation DRIFTNET have acted as a potent deterrent, as the number of sightings and captures of illegal fishing vessels has fallen sharply, due in part the effectiveness of long-range air patrols and satellite monitoring.
Supporting Arctic sovereignty
Ensuring sovereignty in the Arctic is a challenging task especially in a context where Arctic countries dispute territorial sovereignty and maritime rights in the region. Canada has a growing number of defence personnel, navy ships (Canadian Patrol Frigate and submarine patrols) and aircraft operating within the region for both exercises and within bases. In addition DND practices operational defence procedures in the Arctic under three major practices: Nanook, Nunalivut and Nunakput. Nanook is the largest and was conducted in the Baffin Islands in 2011 with 1,100 Canadian and 100 international participants. Nunalivut is conducted in Resolute Bay by about 250 Canadian personnel during the month of April and Nunakput is a two and a half month exercise concentrated in the Beaufort Sea region. In addition, Resolute Bay since 2013 is home to a new military base which can host up to 140 soldiers who undertake surveillance training and rescue operations mainly in winter. The base is shared with researchers from the Continental Shelf Program present in the summer.
Increasing defence activities in the Arctic requires more infrastructure of which space-based assets are playing an essential role:
- The provisioning of robust communications services in the Arctic is imperative for successful command and control of Canadian Armed Forces' operations, both for fixed stations and mobile units (land, marine, and air including UAVs). Satellite systems are preferred given the reliability and transparency of transmission, such that a single hop channel enables greater signal protection from interception. In the future, DND is projecting significant augmentation of communications needs to support mobile and fixed operations.
- Under Polar Epsilon, DND began to equip satellite ground stations with the capability to provide operational use of RADARSAT-2 for Arctic surveillance, a crucial asset considering the development of maritime navigation in the region. Canada's Coast Guard also relies on satellite imagery to fulfill its mandate for ice breaking and ice management, which includes marine traffic routing and escort assistance, channel and travel maintenance, harbour breakouts, flood control, and northern re-supply. Benefits include the reduction of transit times, ice related delays, accidents, and fuel consumption.Footnote 55
Enabling military operations abroad
As of year-end 2013, Canada had about 1,500 soldiers, sailors and air personnel deployed in 14 operations around the world.Footnote 56 This will require the Canadian Armed Forces to have the necessary capabilities to make a meaningful contribution across the full spectrum of international operations, from humanitarian assistance to stabilization operations to combat. Canada has been involved in a large number of international military operations, most often under the auspices of the UN and NATO. The Canadian Armed Forces need therefore to be prepared to deploy at any time in any world region.
Space-based assets are today an essential enabler for the Canadian Armed Forces to be ready to meet the complexity of evolving international challenges, to contribute to international peace and stability, and to deploy military forces to support partners and allies around the world.
Canadian Armed Forces use satellite data for the collection of IMINT (imagery intelligence) and GEOINT (geospatial intelligence) which provide critical support for activities such as:
- Military information activities for both critical decision making and the warfighters (area mapping, target identification, reconnaissance etc.)
- Military planning: Data is used to support logistics of specific missions, plan logistics for deploying resources, run rehearsal scenarios, assess battle damage and evaluate infrastructure
- Critical infrastructure surveillance: Data is used to monitor critical infrastructure, including airports, gas pipelines, etc., to support counter-terrorism intelligence
The Joint Space Support Project (JSSP) further creates a remote sensing situational awareness system which will give Canadian Armed Forces the capability to download imagery directly from commercial satellites as they pass over areas of interest in order to support commanders in the field. The availability and timeliness of these unclassified images will make a significant contribution to international and coalition operations supported by Canada. Further imagery is made available through Canadian cooperation agreements with U.S. defence.
Canadian Armed Forces' personnel and assets (ships, trucks and airplanes) that are deployed overseas are today connected via communication satellites through commercial or proprietary systems. Having access to the U.S. WGS and AEHF satellite constellations provides DND multiple benefits including greater control, greater security, more available bandwidth to military by better tailoring to their specific needs, less risk of interference and maybe more importantly full interoperability with the U.S. and other allied countries' armed forces. In addition, it contributes to DND's information superiority that allows both the rapid deployment of more capable communication networks, with the ubiquity that only satellites can provide in austere environments, but also better intelligence collection and dissemination, as well as shorter and more flexible decision cycles. While the bulk of the capacity is used for surveillance activities, notably to support the use of unmanned aerial vehicles (UAVs), usage areas also include connectivity of military camps for troop welfare, maritime broadband connectivity as well as connectivity for in-theater operations, including an increasing share of mobile broadband applications.
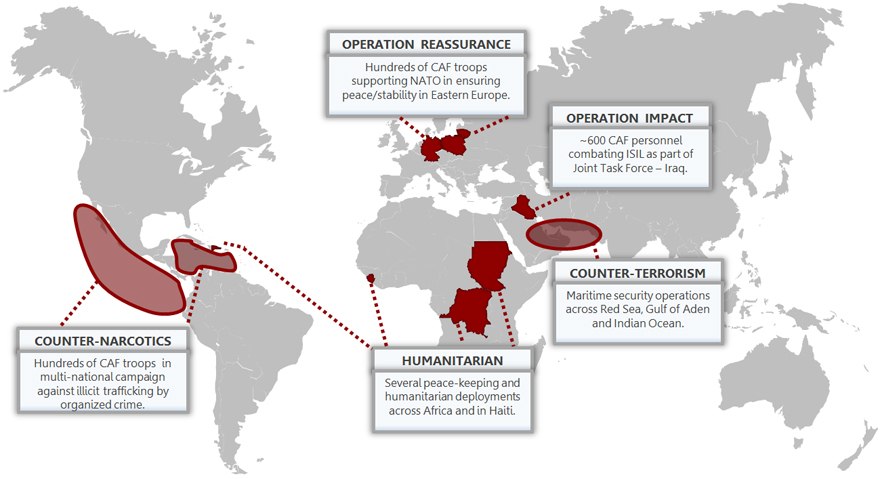
Figure 33 - Text version
The graphic visualization is a map of the world with corresponding sections highlighted and tagged according to the actions taking place in the area.
Along the west and east coasts of Central America (as well as some of the Western Mexican coast), counter-narcotics efforts are being performed, with hundreds of CAF troops partaking in multi-national campaigns against illicit trafficking by organized crime. Humanitarian missions are taking place in Sierra Leone, Congo, and the Sudan. Peace-keeping and humanitarian deployments are operating across Africa and in Haiti. Counter-terrorism efforts are occurring in regards to maritime security operations across the Red Sea, the Gulf of Aden, and the Indian Ocean. Operation impact is occurring in Iraq, where 600 CAF personnel are combating ISIL as part of a Joint-Task Force with Iraq. Finally, Operation Reassurance is occurring in Eastern Europe, with hundreds of CAF troops in Germany, Poland and Lithuania. Operations are supporting NATO in ensuring peace/stability in Eastern Europe.
Source: Department of National Defence
2. Part of Canadians' everyday lives
The space sector, while perhaps not as visibly apparent as other technology sectors, has grown to be increasingly prevalent in the everyday lives of Canadians from ensuring their personal safety to improving their quality of life or being a source of inspiration.
2.1 Space to improve quality of life
Weather services
The provision of public weather services is a standard practise across numerous countries, leveraging space-based assets provided from several counties and coordinated through the World Meteorological Organization (WMO). In Canada, considering the potentially extreme weather experience and large expanse, accurate weather data is essential to support business (such as transportation/logistics), safe practices, other government departments (Transport, Public Safety, Public Health, NAV Canada etc.) as well as providing real-time weather updates and severe weather warnings to the population.
In this regard meteorology services are viewed as an economic enabler, offering support across all sectors, support to business, and quality of life. The U.S. National Center for Atmospheric Research (NCAR) has estimated the value of weather forecast in the U.S. at around $31 billion per year which would correspond to $5.4 billion/year in Canada when applying a value per GDP factorFootnote 57.
Weather services in Canada are delivered through Meteorology Services Canada (MSC), within Environment Canada. Data is derived from both in-situ (weather balloons, buoys etc.) and remote sensing solutions. All solutions are considered complementary in order to provide the most accurate public service.
Extended weather services incorporate air quality monitoring; measuring the level of aerosols in the atmosphere including natural/human pollutants, volcanic ash, total ozone column thickness and greenhouse gases. The MSC also hosts one of the nine global Volcanic Ash Advisory Centres (VAAC) with an international responsibility to monitor activity over the Arctic Ocean, North Atlantic and North Pacific. This incorporates the volcanic areas of the Aleutian Islands and Iceland – the VAAC provided regular updates to support global transport authorities and airlines during the 2010 Iceland volcano event. MSC also supports the Canadian Ice Services (CIS), which provides daily ice conditions related to the country's navigable waters to promote safe and efficient maritime operations, from the Great Lakes to the Arctic Ocean. This type of satellite-based information, including for example 30-day forecasts for ice conditions and wind chill maps, is used by shipping and icebreaking companies as well as to provide public services to support recreational activities.
Travel
With more than one million kilometers of roads, as many as 20 million light vehicles and widely dispersed urban centres, road transportation is the most important mode of passenger transportation in Canada.Footnote 58 As such, space-based positioning systems, notably GPS, play an important role for Canadians in helping to improve the efficiency, cost, safety and environmental impact of their commutes and travels. Through features such as real-time traffic overlays and eco-routing, GPS devices can help shave valuable time off commutes, resulting in fuel savings (between 5% to 15% per year) and lower CO2 emissions.Footnote 59 The number of installed road GPS devices in Canada is estimated to be roughly 5 million as of 2014, split equally between personal navigation devices (PNDs) from companies such as Garmin and in-vehicle systems installed directly by car manufacturers.
As of 2013, an estimated 55% to 60% of Canadians owned smartphones, and mapping/navigation tools, which rely on the space-based GPS satellite constellation. These, are amongst the most frequently used and downloaded applications, trailing only weather, Facebook and games.Footnote 60 GPS-enabled tablets and cameras as well as fitness and tracking devices are also multiplying and when combined with smartphones, it is estimated that there are up to 40 million "location-based service" GPS devices in Canada alone.Footnote 61
Tracking applications such as pay-per-use insurance have been burgeoning in Canada while encouraging safer driving and reducing car insurance premiums. For example, Desjardins Insurance has managed to add nearly 50,000 users in little over a year to its "Ajusto" program, which relies on a credit card sized GPS receiver to track driving metrics such as time, distance, speed, acceleration and braking. The program accounts for nearly 40% of all new policies, and has led to an average annual premium savings of 12% per client.Footnote 62 This space-based system effectively rewards and encourages safer driving habits as reports are sent to clients with information that can be used to further improve premiums.
Entertainment
Space plays a critical role in the distribution of TV programming to millions of Canadians, as satellites carry over 1,200 channels in Canada - providing entertainment, information, coverage of live events, educational content and a means of promoting the country's culture and diversity. Canadians across the nation have long enjoyed the benefits of satellite TV, beginning in 1973 when CBC Radio-Canada became the first broadcaster in the world to use satellites for the full-time distribution of television services using Telesat's Anik A satellite.Footnote 63 From this heritage, Canada's satellite pay-TV market, through leading service providers Bell and Shaw Direct, has grown to serve an estimated 2.7 million households as of early 2014, making Canada the 4th largest national market in terms of satellite pay-TV subscribers in all of the Americas.
Figure 34: Canadian subscribers to satellite TV services (1995-2013)
| 1997 | 1998 | 1999 | 2000 | 2001 | 2002 | 2003 | 2004 | 2005 | 2006 | 2007 | 2008 | 2009 | 2010 | 2011 | 2012 | 2013 | |
|---|---|---|---|---|---|---|---|---|---|---|---|---|---|---|---|---|---|
| Canadian subscribers to satellite TV services (1995-2013) | 84,000 | 305,000 | 756,000 | 1,258,000 | 1,749,000 | 2,083,000 | 2,197,000 | 2,328,000 | 2,557,000 | 2,657,000 | 2,703,000 | 2,745,000 | 2,851,000 | 2,910,000 | 2,910,000 | 2,814,000 | 2,693,000 |
Source: Euroconsult.
These satellite TV subscribers account for nearly 20% of all households in Canada or roughly 7 million people, many of whom are located in rural communities with few terrestrial alternatives. The ubiquitous reach of satellite is one of its primary advantages, as it can help introduce competition to markets which are underserved due to the prohibitive costs of rolling out last-mile terrestrial networks, a key challenge in Canada given its low population density.
Satellites have also enabled the more recent evolution of satellite radio services in Canada. As of 2014, over 2.5 million Canadians subscribe to Sirius XM's satellite radio service.Footnote 64 Over 5.5 million cars in Canada are estimated to be equipped with satellite radio receivers, which are also expected to be installed in over 60% of the country's new cars. Subscribers benefit from enhanced content, fewer commercials and ubiquitous coverage in comparison to local free-to-air radio offerings.
Broadband connectivity
Satellite broadband connectivity services have flourished in recent years. In 2004, Telesat's pioneering Anik F2, built in collaboration with the CSA and Canadian industry, introduced the world's first two-way broadband connectivity to Canadian homes. Today the satellite broadband market in Canada is the second largest national market globally, with an estimated 200,000 subscribers as of 2014, the bulk of whom are located at the outskirts of urban population centers. This represents roughly 2% of all broadband internet subscriptions in Canada.Footnote 65 The number of satellite subscribers is expected to increase steadily over the coming years, as Xplornet, Canada's leading satellite service provider to the consumer segment, has contracted a significant volume of high-throughput capacity aboard next-generation satellites launching in 2016, offering vastly expanded coverage of Canada and its Northern regions. This new satellite capacity will provide Xplornet with the ability to serve nearly all of Canada's growing rural population, which currently corresponds to about 20% of the total population, with data rates of up to 25 Mbps.
Figure 35: Canadian subscribers to satellite internet broadband services (2004-2013)
| 2004 | 2005 | 2006 | 2007 | 2008 | 2009 | 2010 | 2011 | 2012 | 2013 | |
|---|---|---|---|---|---|---|---|---|---|---|
| Canadian subscribers to satellite internet broadband services (2004-2013) |
200 | 5,000 | 12,500 | 22,500 | 47,000 | 87,500 | 117,500 | 127,500 | 150,000 | 185,000 |
Source: Euroconsult.
Satellite plays an important role in bridging the digital divide where comparable terrestrial networks are too costly to implement. This is particularly true in the Arctic where satellite is a primary source of communications for communities. Its remoteness, long distances, harsh environment and low and widely‐dispersed population present significant challenges in developing the region's communications infrastructure. As such, satellites play a critical role in the communications infrastructures of many Northern communities and help bridge the digital, demographic and economic divides with the rest of Canada. It is estimated that roughly 45% (20,000) of households in Canada's Arctic region are served by satellite. Of these households, 7,000 are estimated to be satellite broadband subscribers and 13,000 are estimated to be backhauled by satellite through 40 to 50 cellular backhaul and IP trunking sites. In total, 35 Northern communities, including one in the Yukon, 10 in the Northwest Territories and all 25 communities in Nunavut, currently rely on satellite as a telecommunications backbone, providing vital social and economic links with the rest of Canada and the world.Footnote 66 However significant challenges still exist, as a lack of terrestrial infrastructure and available satellite capacity have pushed prices for broadband connectivity (5 Mbps) in rural Northwest Territories and Nunavut to $370, and $500 per month respectively, well over five times the national average.Footnote 67
Telesat's Anik F2's service outage, which is highlighted in the case study below, illustrated how much Canadian Northern territories are dependent on satellites for many aspects of their communications infrastructure and services.
Case study #7 A day without space in the North
The issue
- Launched in 2004, Telesat's Anik F2 was one of the world's first satellites to successfully commercialize consumer broadband services.
- The satellite carried traditional C- and Ku-band capacity, as well as a demonstration Ka-band payload designed in part to help connect Canadians living and working in remote, rural communities, notably in the far North. The pioneering technology was developed through a private-public partnership involving the Canadian Space Agency, Industry Canada, Telesat and COM DEV
- On October 6th, 2011 a software update to Telesat's Anik F2 satellite caused it to abruptly enter safe-mode and turn away from the Earth to face the sun in order to charge its batteries.
- The result was a service outage that lasted nearly a day, with widespread repercussions across North America, most notably in Canada's Northern territory of Nuvanut. With communications severed in many communities, residents were affected by interruptions to flights, ATMs, long-distance phone, cellular, internet and some video services.
The impacts
- Northwestel reported that 39 communities (roughly 7800 people) across Nunavut, N.W.T. and Yukon that receive their long distance phone service via satellite were affected by the outage. SSI Micro, another Northern telecom provider, also reported that its voice and data communications services were interrupted, leaving handheld satellite phones as the sole means of communicating with the rest of Canada.
- NAV Canada reported that its radar, navigation, weather and communications systems were affected. The impairment to air traffic control systems resulted in the cancellation of well over 50 flights to and out of Northern Canada, stranding over 1000 passengers. No supplies could enter and those with a medical emergency could not be airlifted to a hospital.
- The near total loss of communication services in Nunavut had an impact on worker productivity, with almost 90% of the respondents to a survey on the satellite's outage reporting that their productivity was adversely affected.Footnote 68
- Point-of-sale systems and ATMs fell offline: residents in affected communities could not purchase goods or withdraw cash.
- The effects of the satellite's shutdown were also felt much further south, as TV customers of Shaw Direct, Bell Alliant and Videotron in certain regions suffered impaired service. Further south in the United States, service was also cut for more than 140,000 of satellite ISP Wildblue's (now Viasat) broadband internet subscribers.
2.2 Space to improve population's safety
Personal safety
Maintaining safety and security for Canadians has always been at the forefront of Canada's priorities and space plays a pivotal role in supporting safety-related programs and activities.
The COSPAS-SARSAT program, created in 1982 by the governments of Canada, the United States, France, and the former Soviet Union, is a concrete example. Today, the program serves 43 participating and over 100 user nations. The program acts as an international search and rescue satellite system, using emergency beacons to relay distress calls through satellites to the appropriate national and regional search and rescue organizations. This system is the sole global network capable of independently locating (e.g., without the aid of GPS) distress beacons of aircraft, ships and backcountry hikers. Since its inception, COSPAS-SARSAT has aided in the rescue of roughly 35,000 people across the world from plane crashes, sinking ships and wilderness mishaps, including at least 1,500 Canadians.Footnote 69 The majority of rescues are maritime in nature, bringing a specific benefit to Canada given the fact that the country has the world's longest coastline. COSPAS-SARSAT is currently upgrading its satellite system, for which COM DEV will supply payloads developed in partnership with the CSA, ensuring that Canada and its space sector will continue playing an important role in the world's search and rescue systems for years to come.
The Canadian Coast Guard's integrated search and rescue system (SAR) utilizes the COSPAS-SARSAT system, alongside several other terrestrial and space-enabled navigation (GPS) and communications solutions such as the Global Maritime Distress and Safety System (GMDSS), which helps ensure rapid distress alerts for all radio-equipped vessels, regardless of size. These space solutions have contributed to the Coast Guard's search and rescue effectiveness, particularly in remote regions of Canada such as the Northern Passage where terrestrial infrastructure is limited and maritime traffic, for both leisure and commerce, has increased sharply in recent years. Nearly 97% of lives at risk in maritime distress situations are saved each year by the Coast Guard and its SAR system, equating to roughly 2,200 saved lives, and another 18,000 people are helped each year in non-distress maritime incidents.Footnote 70
GPS plays an essential role regarding airlines passengers' security. The 122 million passengers who are travelling to and from Canada's airports each year are safer due to space-enabled communications and navigation solutions, as GPS position-reporting is an integral component of Canada's air traffic control backbone.Footnote 71 In addition, Globalstar Canada's SPOT communications products, which transmit GPS coordinates through its satellite network, have been used to initiate nearly 1000 successful rescues in Canada alone since 2007.
Disaster management
Although Canada does not have the climate or geology as certain areas of the world which are more susceptible to major disasters, it is still prone to certain elements, such as forest fires and flooding, with impacts on both commercial enterprises (such as forestry) and on the population. To this regard satellite-based solutions such as Earth observation assist along all phases of the disaster cycle from early warning to alert and response, and finally post-disaster recovery. It can be inhibited by the timeliness of delivery, with continuous real-time data required to constantly monitor developing situations. In this instance, multiple data sets need to be coordinated so that when they are available, they can be integrated into a wider data collection capability. The International Charter, Space and Major Disasters ("The Charter"), in which Canada through the CSA is a member, aims to provide this coordinated approach. Created in 1999 and operational since 2000, the Charter counts 15 international members nominally represented by space agencies.
The Charter aims at providing a unified system of space data acquisition and delivery to those affected by natural or man-made disasters. Since its inception, the charter has been activated approximately 450 timesFootnote 72. Eleven of these were activated by Canadian authorized users in order to deploy space based-assets to monitor flooding, forest fires and severe weather. In 2012 the Charter was activated to monitor flooding of the Fraser River in British Colombia, and in 2011 it was activated by Public Safety Canada to monitor files in Alberta. Another example of the Charter activation was the Lac Megantic disaster in 2013 following a request from Transport Canada to Public Safety Canada. The solutions brought by space-applications during this event are detailed in the case study below.
Case study #8 Lac Megantic
The situation
- In July 2013, a train carrying crude oil exploded in the centre of the town of Lac Megantic in Quebec, killing 47 people. It was the worst train disaster in Canada since 1864. The subsequent explosion and fire destroyed approximately 40 buildings covering a 2 km2 area.
- The fire lasted four days, consuming nearly six million liters of oil. Rehabilitation companies were only able to access the site and initiate the recovery process after five days. These organizations cut, washed and contained parts of the train, while other organizations pumped oil that had worked its way into the water system contaminating it.
- The Charter was activated by Public Safety Canada following request from Transport Canada.
- Canadian services company Effigis was responsible for the data processing and services delivery to support relief efforts as part of its mandate in the CSA's Rapid Information Products and Servcies (RIPS) program. Data used was from DigitalGlobe (US) and Airbus (France).
Space-based solutions
- High resolution satellite imagery was used to monitor and guide progress of the site management and recovery following the disaster event. Data continued to be provided 4 months after the event to monitor any longer term impacts – for instance, oil seeping into the water system, and impacts on ecologies surrounding the incident site.
- Pleiades high-resolution satellites were used to acquire 9 images from the time of the explosion, July 6, 2013 leading to November 4, 2013. The images were processed using image analysis software to make them perfectly stackable for ingestion into a GIS, and in order to more easily define change detection.
- As and when the images were obtained and processed, they were made available to agencies responsible for coordinating the work on the ground. They had access to an overall view of the affected site and could guide and optimize the efforts of the rehabilitation teams. Progress of the work was also able to be documented.
2.3 Space to inspire
Maximum visibility is an objective of the Canadian space program. In a poll by the Dominium InstituteFootnote 73 in 2008 where 3,114 Canadians were asked "What is Canada's defining person, event, place, symbol and accomplishment?" the Canadarm was voted as the fifth most popular icon defining Canada, ahead of Niagara Falls and the CN Tower. Special initiatives such as the 2014 unveiling of the Canadarm on the Canadian five dollar bill ensure that such accomplishments remain in the consciousness of the population on a day to day basis. Space industrial actors, universities, the Canadian Space Agency and a variety of society and interests groups make efforts to promote space to the population.
Communicating the value and benefits of space to the population is a vital part of increasing the inspirational potential of space. Social media measures how the public relates to Canadian space efforts, including the effect of high profile events such as CSA astronaut Chris Hadfield's 2014 mission to the ISS, which captured the imagination of Canadians. The changing technological landscape also calls for new and engaging ways to catch and keep the public's attention, which has resulted in increased use of social media to disseminate information.
Initiatives to engage the public
In collaboration with the Canada Aviation and Space Museum, the CSA developed an exhibit to allow young visitors to learn how to adapt to the rigours of daily life on board the International Space Station, discover how astronauts work and play in a weightless environment, and how they tackle such basics as personal hygiene, eating and sleeping etc. Over 563,000 visitors have seen the multimedia exhibit since it opened in 2011. In addition, the appeal of human space flight and space exploration is used to stimulate the public interest: Over 130 astronaut presentations were coordinated by the CSA between 2012 and 2014. In 2009, the CSA conducted a national astronaut recruitment campaign whereby 5,438 Canadians applied for two positions.
Many initiatives are focused on young Canadians in elementary and secondary school to encourage them to pursue studies and careers in STEM (science, technology, engineering and mathematics) subjects, in an effort to support the development of a highly qualified work force in Canada from an early age. Initiatives such as the Canada from Space Floor Map, the Tomatopshere project and CSA-developed educational resources have been used by thousands of school children.
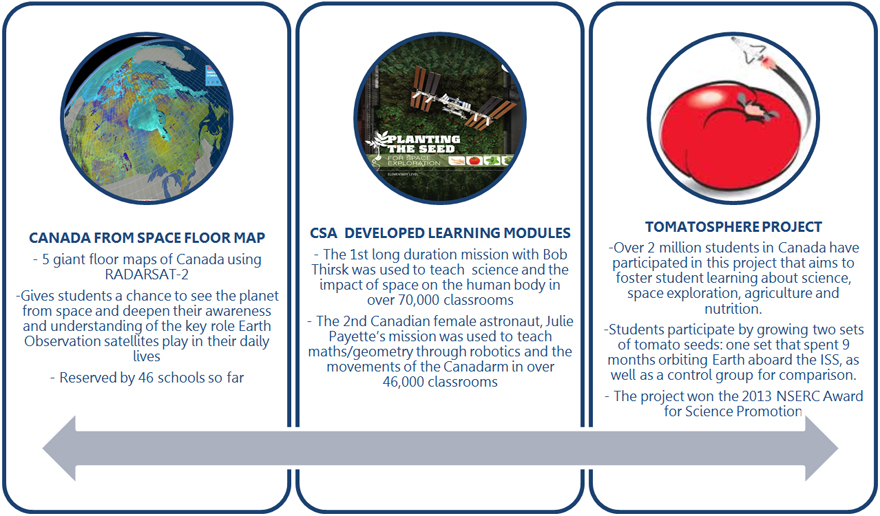
Figure 36 - Text version
The visualization is that of three different blocks, with an image of each selected category and a series of facts presented underneath.
The first block is Canada from Space Floor Map. The image presented is that of a mapping of Canada on the global scale. The information provided indicates that 5 giant floor maps of Canada have been made using RADARSAT-2. It gives students a chance to see the planet from space and deepen their awareness and understanding of the key role Earth Observation plays in their daily lives. So far the system has been reserved for 46 schools.
The second block is a CSA Developed Learning Module, with an image of a satellite being planted into the ground. The first long duration mission with Bob Thirsk was used to teach science and the impact of space on the human body in over 70,000 classrooms. The second Canadian female astronaut, Julie Payette's mission was used to teach maths/geometry through robotics and the movements of the Canadarm in over 46,000 classrooms.
The final block is a picture of a tomato to represent the Tomatosphere Project. The information provided underneath indicates that over 2 million students in Canada have participated in this project that aims to foster student learning about science, space exploration, agriculture, and nutrition. Students participate by growing two sets of tomato seeds: one set that spent 9 months orbiting Earth aboard the ISS, as well as a control group for comparison. The project won the 2013 NSERC Award for Science Promotion.
Source: CSA
Images: Canadian Geographic, CSA, Tomatosphere
Canada has a variety of space activist and advocacy groups that promote space activities to the wider population while focusing on initiatives to advance the industry and increase the opportunities available for the group members. These groups and organizations are generally established around three objectives: The development of a space-aware society through technical and outreach projects, supporting activities of academic institutions and industrial advocacy. Many of these organizations host events across Canada highlighting space research and the benefits of space engagement. For example, the Canadian Space Society's annual space summit hosts public events geared towards educating everyday Canadians on Canadian contributions to space exploration. The society hosts regular round tables, exhibits and tributes. These organizations work to ensure that space issues remain in the public agenda and that the benefits derived from space are shared.
Social media
Social media platforms provide insights into what people like or find important with the number of followers, trending topics etc., providing an indication of the public interest of technology savvy citizens. While the space sector is still fairly conservative in the use of social media, its use is gradually increasing. Figure 37 shows that the CSA is significantly "supported" in particular with regards to YouTube and Twitter when compared to similar organizations. This engagement with the public through a variety of mediums – that the public can also control through their "shares" – ensures that Canadian achievements are spread even to those who would not necessarily have been aware or interested in space activities. Since 2010, CSA's website has recorded over 5 million unique visits.
Figure 37: Social media activity of CSA and other agencies
(number of visitors/followers)
| YouTube | |||
|---|---|---|---|
| CSA | 77,083 | 152,000 | 216,088 |
| Health Canada | 9,415 | 136,000 | 1,537 |
| Explore Canada | 303,789 | 141,000 | 10,570 |
| Hockey Canada | 540,508 | 183,000 | 3,704 |
The AuroraMAX, a national public engagement initiative launched in 2009, has been one of the biggest draws to the CSA's website, ensuring the website receives over one million hits a year. Established in partnership with the CSA, the University of Calgary, the City of Yellowknife and the Astronomy North Society, the initiative is dedicated to raising awareness of the impact of the Sun on Earth, and the important role Canada is playing to support science in the Arctic. The project focuses on live broadcasts of the aurora from just outside Yellowknife. As a result, aurora tourism appeared to benefit: From 2011 to 2012 tourism to Yellowknife aurora viewing sites reached 7,400 and $10 million in spending (up from 6,800 visitors and $6 million in spending the year before). By the end of the 2012/13 season, about 15,700 visitors identified aurora viewing as the main purpose of their trip, and total spending reached $15 million.Footnote 74
The CSA and Chris Hadfield's use of social media, clear messaging and engaging storytelling had a significant impact on the Canadian people and the visibility of the national space program, as outlined in the case below.
Case study #9 Long duration space mission with Chris Hadfield (2012)
Mission bacground: Expedition 34/35
- Chris Austin Hadfield is an engineer and former Royal Canadian Air Force Pilot selected to become one of four astronauts from a field of over 5000 applicants in 1992.
- He served as a mission specialist on two flights: STS-74 in 1995 and STS-100 in 2001. Then, he served on ISS Expeditions 34 and 35 including as part of Commander for Expedition 35.
- On December 19, 2012 Chris Hadfield launched aboard a Soyuz spacecraft to the International Space Station. On March 13, 2013 he would become the first Canadian Commander of the Station. His mission lasted for five months. He was joined by eight American and Russian astronauts and cosmonauts.
- The mission objective was to carry out scientific experiments; test new technologies; to operate the Canadarm 2 and perform robotic tasks.
- Following his extensive engagement on social media and successful mission Chris Hadfield now ranks as one of the most influential and famous astronauts of the current generation.
- 130+ experiments were conducted during the mission.
Public awareness impacts
- The mission helped raise awareness and visibility of Canada's space program, and was particularly successful engaging younger generations:
- 24 live events with students were held over the five month mission. One event was a live concert with Chris from space which attracted close to a million participants across Canada.
- 7000 students from over 300 schools performed the same radiation experiment as Chris in space.
- Two 3D educational resources for school children were developed using a Chris Hadfield avatar: 42,000 requests were made from classrooms reaching over one million students.
- 88 videos of science and weightlessness were produced during the mission and viewed over 42 million times.
- 12,267 news items have been reported mentioning the mission in Canadian media (Dec 11, 2012-June 12, 2013) -- six times the yearly average for the CSA as a whole. A minimum of 7,323 news items in international news.
- Of the mission WebPages viewed, 75% of them were from new visitors. Nearly 90% of the traffic to the website originated from social media during the mission.
- The CSA developed strategic partnerships with the National Film Board, Lets Talk Science, the Coalition for Music Education Amateur Radio, the Toronto Maple Leafs and Science centers across the country for this mission, helping reach a new and wider audience.
- A tribute to David Bowie's "Space Oddity" further introduced space to a non-space audience
3. Protect and manage our environment
Space solutions provide unique advantages for both climate change monitoring and natural resource management, helping governments and private enterprise protect and manage our environment. Satellite data provides essential information to several economic sectors (including agriculture, forestry and oil and gas), providing, benefits such as assessment of crop health and yield, improving security through monitoring of expansive territory and identifying pollutants in the lakes and oceans.
3.1 Climate change
How space is used for climate change purposes
Satellite data is used in three key application areas to respond to climate change monitoring objectives:
- Atmospheric research, relating to elements such as air quality and meteorology R&D into longer-term atmospheric evolution, including atmosphere consistency, emissions and numerical weather prediction
- Oceanic research, covering ocean surface and subsurface monitoring, including temperature, salinity, sea level, sea ice, current and ocean color. EO-derived products include support to meteorology ocean (MetOcean) services. Linkages with atmospheric variables permit a better understanding of weather systems
- Terrestrial research, primarily on land cover mapping, to provide the basis for a number of other applications (such as distribution and composition maps of land-based ecosystems) and monitoring of land-surface changes (such as through the onset of urbanization or desertification). Global-scale applications in support of data collection on climate variables such as nitrogen fixing, carbon cycles and global forest indices are also of high significance
Why it is important for Canada?
Considering the size of the Canadian land mass, the extent of its ocean borders, and its significance as a host for extensive forested and ecological sensitive areas, the importance of monitoring local climate variables in Canada is vital as it is an input into global environment monitoring.
There is great significance for each of these application areas to leverage Canadian space-based assets globally to monitor climate change phenomena, as well as the use of all (including 3rd party) assets to monitor phenomena over Canadian territory. For instance:
- Aerosols are one of the most uncertain components of climate change. Lower atmospheric composition analysis calls for monitoring and tracking of gases detrimental to the atmosphere. For instance, evaluation of ozone and aerosols for global forecast models increases understanding of clouds and radiation to improve weather forecasting
- Alongside national objectives to protect Canada's oceans, Canadian scientists are committed to understanding the role of oceans in influencing and mitigating the effects of climate change. Following enactment of the Oceans Act in 1997, Canada became one of the first countries to establish a comprehensive approach for the protection and development of its oceans and coastal waters. As a result, more than 23 federal departments have mandates that impact ocean policies and outcomes
- Monitoring land ecologies is required at multiple governmental levels, which ranges from monitoring the impact of industrial processes to the monitoring of Canadian forests for carbon sequestration and international reporting. Identifying, delineating and mapping land cover is important for understanding land-surface processes and for obtaining information on land cover type, land use, and other land surface attributes, which underpin strategies for land management.
Table 14 provides a selection of concrete climate change issues to which space based applications are bringing or have brought specific solutions.
| Issue | Solutions using satellite |
|---|---|
| At mid-latitudes over Toronto, under clear skies, a 1% decrease in the thickness of the stratospheric ozone layer results in about a 1.1% to 1.4% increase in UltraViolet-B radiation at ground level.Footnote 75 Considering approximately 200 species of Canadian crops and trees are to some degree sensitive to increased levels of UV-B as well as freshwater ecosystems, efforts to forecast fluctuations are supported using satellite data. | Increasing ozone depletion over the Artic is reported despite the positive effect of the Montreal Protocol ban on ozone-depleting substances. However, in November 2014, data derived using the CSA's SCISAT satellite concluded that the recent increase in ozone-depleting chemicals in the lower stratosphere of the Northern Hemisphere is due to reduced atmospheric circulation in the Northern Hemisphere and is therefore a result of CFC's produced before the ban was put in place. |
| Canada is committed to shift to a low-carbon economy and is one of the first countries to implement a national system capable of reporting annual carbon emissions from wildfires using space-based assets. | The National Inventory System uses satellite and forest fire data to track and report on the carbon emissions generated by wildfires through detecting high-temperature areas called "hotspots". |
| Monitoring of industrial process and impacts on air quality is a growing concern, such as monitoring oil sands developments, including industrial smokestacks, tailings ponds, transportation, and dust from mining. | Satellite imagery is used to develop air quality to build a comprehensive inventory of emissions and to assess the status of contaminants in areas where there is limited in-situ monitoring.Footnote 76 |
| MetOcean products help to provide a better understanding of oceanic processes, as well as the links between the atmosphere and ocean processes through better monitoring and forecasting. | Determining the impact of ocean processes on global climate patterns requires that EO data is built into operational oceanography to predict phenomena such as ocean currents, winds and climate variability. Satellite communication systems also support monitoring. Argo is an international collaboration that collects temperature and salinity profiles. Of the 3,500 automated floats that collect this data, Canada has 112 reporting through the ARGOS and Iridium systems.Footnote 77 Argo data is used for a variety of purposes including improving weather forecasts, developing ocean models, etc. |
| Monitoring vegetation biomass/land cover is required to assess trends in land cover change and what can be inferred for wider climate change. | Derived in part from satellite imagery, the Agriculture and Agri-Food Canada Biomass Inventory Mapping and Analysis Tool (BIMAT) is an interactive mapping application that provides Internet-based Geographic Information System functionality to query and visualize biomass inventory data in order to support ranging applications. Improved forest classifications through Earth observation is a further important application by being able to differentiate between actual deforestation and forest damage caused by other factors, such as fires or invasive species. |
Resource management
How space is used for resource management purposes
The monitoring of national, regional and global resources is becoming ever more important due to a number of factors, including rising population and progressive infringement on natural terrains, effects of severe weather, changing climate and the global economic situation exerting pressure on natural (and engineered) resource exploitation. Satellite data provides dedicated solutions to four key sectors regarding resource management purposes:
- The agriculture sector focuses on applications to support agriculture profitability and sustainability. The focus of the applications includes mechanisms to improve crop yield and monitor crop health, and cost-saving mechanisms such as limiting the use of fertilizers, etc. Earth observation data (aerial and satellite) is currently used in a variety of applications covering change detection (such as for monitoring of crop health), crop inventory mapping and soil properties mapping. Outputs from these agricultural applications are in the form of crop health information (for instance indicating where certain fields need attention for irrigation, fertilization, etc.), crop insurance claim verification and crop stress mitigation, amongst others.
- As with agriculture, the forestry sector targets applications to support forestry profitability and sustainability, with the purpose being to monitor national, regional and global resources. These applications includes ways to improve forest yield and productivity, to monitor sustainable logging activities (including subsequent reforesting activities), and to monitor threats to forests, such as identifying pests. EO is used in various applications such as in supporting logistics, monitoring forest health/deforestation, etc. Resulting solutions from these applications include forest biomass calculations, forest inventory, prediction and early warning of forest fires, etc.
- The energy sector has been a long-term user of EO data, especially for oil, gas and mineral exploration and exploitation. Demand is high, responding to growing populations, increased urbanization and industrializationFootnote 78. This has driven exploration targets into increasingly remote areas, with growing emphasis on efficient business practices to support maximum profitability. EO data for instance supports the exploration process for defining plays, supporting operations and logistics and ensuring environmental/corporate sustainability.
- Water resources management ensures water quality and fresh water availability and supports sustainable fisheries and aquaculture. Water quality for instance can be impacted by man-made and natural processes which must be monitored. For example, mineral extraction activities and the resultant waste from the process (or tailings) can enter water supplies and change its composition. Agriculture irrigation and land management processes can also have a direct impact on water quality.
Why it is important for Canada?
Canada is a resource-rich country. Being able to manage those resources is key for the country's economy and to ensure sustainability. Monitoring these resources is essential in order to ensure efficient and secure business practises and environmental protection. To continuously monitor resources, space-based assets are often the most economical solution for Canada's vast land mass.
- Canada has the third largest endowment of arable land per capita in the world.Footnote 79 In 2012, the Canadian agriculture and agri-food system generated $103.5 billion for the Canadian economy, accounting for 6.7% of Canada's GDP.Footnote 80 Data sets using satellite imagery have proved particularly significant for maintaining the viability of the agriculture sector.
- Canada is the second largest exporter of primary forest products in the worldFootnote 81 and according to Natural Resources CanadaFootnote 82, derives more net benefit from trade in forest products than any other country. In 2013, production in the forest sector generated $57.8 billion for the Canadian economy, accounting for 1.3% of Canada's GDP. With 192 forest-dependent communities in Canada,Footnote 83 maintaining the profitability of the forestry sector is of primary importance.
- Canada is the world's fifth largest producer of crude oil and natural gas and as one of the largest mining nations in the world produces more than 60 minerals and metals. Combined, the energy and mining sectors contributed over $170 billion to Canada's GDP in 2013 – over a quarter of the value of the goods-producing economy.Footnote 84
- Canada has the third highest reserves of drinkable water globally. An adequate safe and reliable water supply is critical for every community as a source of drinking water and for recreational purposes. An estimated 60% of Canada's GDP is directly dependent on water, supporting a variety of sectors including resource extraction, manufacturing and the production and processing of food.Footnote 85 Over 20 departments and agencies have unique responsibilities for fresh water in Canada.
- Canada's expansive national parks system, covering over 3% of its landmass, is designed to help protect and showcase the country's wealth of natural landscapes and ecosystems.Footnote 86
Table 15 provides a selection of concrete resource management issues to which space based applications are bringing or have brought specific solutions.
| Issue | Solutions using satellite |
|---|---|
| The goal of forestry applications includes ways to improve forest yield and productivity, to monitor sustainable logging activities (including subsequent reforesting activities), and to monitor threats to forests, such as identifying and monitoring invasive species and forest fires. | The Canadian Forest Service, in partnership with the CSA, is using space-based Earth observation technologies to create products for forest inventory, forest carbon accounting, monitoring sustainable development, and landscape management to support Canada's stewardship of its forestry resources. |
| Maintaining the integrity and security of infrastructure is also a priority for the sector. With at least 110,000 kilometers of transmission pipelines in Canada, the network is three times the length of Canada's national highway system.Footnote 87 Due to the rapid expansion of Canada's oil sands over the next decade, new pipeline infrastructure will have to be built to accommodate the increase in supply and market requirements. | Projects such as the Critical Infrastructure Monitoring for the Energy Sector (CIMES) or the Integrated Pipeline Monitoring Geohazard Monitoring Service (IPGMS) provide operators with solutions for broad area monitoring of their critical infrastructure, allowing for more effective use of ground-based monitoring activities and more accurate targeting of mitigation efforts. |
| Understanding the state and trends in agriculture production through inventory is essential in order to prevent both short-term and long-term threats to stable and reliable access to food through supporting programs to understand, assess, predict, mitigate for climate variability and its associated risks, improve land management decisions and to ensure a profitable agricultural sector. | Starting in 2009 Agriculture and Agri-Food Canada began the process of generating annual crop type digital maps using satellite imagery. In the 2011 growing season, this activity was extended nationally. The Crop inventory is ranked 15th for most downloaded government data sets (as of October 2014). The datasets are used to support policy decisions for land management practice, support insurance claims, and identify trends in crop yield/health, amongst others. |
| To manage Canada's water resources, the main goals of the government are to protect and enhance the quality of the water resource and to promote the wise and efficient management and use of water. The increase in sediments, pollutants and nutrients runoff from a growing population and changes in land use puts greater pressure on ensuring water quality and protection of sensitive ecosystems. | Harmful algal blooms can develop as a result of man-made activities (such as from fertilizers within agriculture processes). Using EO data can help to identify farmed areas/watersheds which are the main causes; mitigating actions can be taken to prevent further damage to farmland (caused by land degradation) and the water system. |
| Canada's expansive national parks system (3% of landmass) is designed to help protect and showcase the country's wealth of natural landscapes and ecosystems. These 42 national parks, 167 national historic sites and four marine conservation areas receive over 20 million visitors per year. Proper management is critical to help ensure that future generations benefit from the education and enjoyment these resources provide. | Parks Canada, utilizes a variety of space-based assets to help its management, planning and operations. Both GPS and EO data are used to support research and monitoring activities including mapping, land use planning and wildlife tracking, which are all critical in order to help improve the understanding and management of the parks' ecological integrity. Satellites are also utilized to help connect remote sites and employees within parks, with hundreds of satellite phones and VSATs deployed. |
4. Foster international collaboration
Through deliberate and focused investments in R&D, reliably engaging in international cooperation and ensuring that Canadian contributions have visible value, Canada has been able to augment its national program through broad collaboration with international partners.Footnote 88 These collaborations brings multiple benefits to Canada including, among others, to participate to programs it could not afford otherwise and share in the global outcome of such larger programs (for example, astronauts flights in return from contributing the Canadarm2 on the ISS), undertake its programs in a more cost-efficient way, deliver on international commitments, promote relations between governments and improve outcomes for Canadian industry abroad.
4.1 Scope of international cooperation
In carrying out its objectives, the CSA is authorized under the CSA Act to "cooperate with the space and space-related agencies of other countries in the peaceful use and development of space".Footnote 89 Since its inception, the CSA has signed close to 200 bilateral and multilateral agreements with over 24 countries in seven regions.Footnote 90 While only 79 of those agreements, comprising of amendments to existing projects and new projects, are in operation at year end 2014, a historical assessment of all agreements the CSA has signed highlights the broad gains that Canada has experienced through cooperating with foreign governments. By far the agency with which the CSA cooperates the most is NASA, with 76 signed agreements. As Canada's largest trading partner, not only does Canada have access to U.S. missions such as the New Frontiers Program or the MARS science laboratory mission, providing instruments, equipment and expertise, but Canada also utilizes NASA services in support of Canadian activities. With 73 agreements signed with 13 European entities, cooperation in Europe is driven by Canadian associate membership to the European Space Agency, as highlighted in the following section, and substantial cooperation with France.
Canada's niche strategy is reflected in the focus of the application areas which the signed agreements cover. The application areas are evenly split between Space Exploration/Manned Spaceflight, Space Science and Exploration and Earth Observation. These domains lend themselves easily to international cooperation through data and information sharing, the scale of which would be impossible on a unilateral basis.
Figure 38: Distribution of agreements by application domain (1990-2014)
Total agreements signed: 197
| Europe | North America | Oceania | Russia/CIS | Latin America | Multinational | Asia | MENA | |
|---|---|---|---|---|---|---|---|---|
| By region | 73 | 76 | 1 | 4 | 4 | 18 | 18 | 3 |
| General/Other | Space Science | Exploration / Manned spaceflight | Satcom/Satnav | Technology | EO | |
|---|---|---|---|---|---|---|
| By application area | 56 | 43 | 48 | 5 | 5 | 40 |
Source: CSA
Canada has contributed to or led over 70 different missions or projects through international cooperation. As detailed in Table 16, 44 agreements with the main objective to develop technology, experiments or equipment, 75% have been foreign led missions, where Canada is a contributor to the mission. The other 25% of missions were Canadian-led missions whereby foreign governments were given access to Canadian missions, increasing the overall research efforts through the foreign contributions. A good example of this is the integration of a Belgian equipment contribution to the Canadian satellite SCISAT-1.
| Missions | # |
|---|---|
| Missions/Projects | >70 |
| Incl. provision technology, equipment, experiments | 44 |
| Foreign led mission | 33 |
| Canadian or joint led mission | 11 |
Source: CSA
4.2 Benefits of international cooperation
Leverage data access
The opportunity to access data or information is an important benefit of international cooperation resulting from Canada's in-kind contribution to foreign missions. The presence, in Canada, of contractors who are capable of contributing space technologies enables the access of the downstream community to data and information it does not have or cannot readily produce. This is creating an essential link between upstream capability and downstream benefit.
This is particularly useful for activities such as monitoring global phenomenon or access to observatory data, whereby through negotiating preferential access, Canadian researchers can contribute to the advancement of science and opportunities for new discoveries. Examples include:
- The Astro-H or NASA James Webb Telescope where Canada secures positions from Canadian institutions on the mission's Science Working Group, involving top scientists from around the world and has access to 5% observing time through participation. ASTRO-H will mark the first time Canada is part of an X-ray astronomy mission that will explore the unseen Universe in unprecedented detail.
- The NASA Osiris-Rex mission where Canada has access to 4% of the asteroid samples (expected to be as large as 1kg of regolith) returned from the mission. It will mark the first time that Canada has had direct access to a returned asteroid sample, ensuring that Canada can contribute to addressing fundamental questions about the composition of the solar system.
Canada has also entered into exchange agreements for a variety of circumstances, including data sharing in the event of satellite failure or information exchange regarding ground control or satellite operations and has signed loan agreements for access to certain equipment or materials.
Meet international commitments
International collaboration for increased space data, capacity and connectivity has enabled Canada to meets its obligations on a range of issues from supporting allies and partners to upholding reporting commitments under the United Nations Framework Convention on Climate Change and the establishment of Integrated Satellite Tracking of Pollution (ISTOP) programs in support of treaties that seek to minimize oil pollution.
For example, Canada is committed to providing appropriate, timely and effective humanitarian assistance to foreign countries in times of need and has harnessed the ability of satellite technology to fulfil this objective. Following natural disasters, Canada provides access to satellite imagery, either through established mechanisms of international cooperation or directly to governments and entities needing such data and information to support their citizens and infrastructure. One such cooperative mechanism is the International Charter on Space and Major Disasters, which aims at providing a unified system of space data acquisition and delivery to those affected by natural or man-made disasters. Comprised of 16 members, the Charter provides on a voluntary basis that each party shall use their best endeavours to meet the stated objectives. Out of 439 activations of the Charter between 2002 and 2014, Canada's RADARSAT data has been provided to authorize users on over 340 occasions. As the most frequent outcome of natural disaster events recorded has been flooding, which usually occurs under rainy or cloudy conditions, the use of RADARSAT 1/2, with its all-weather SAR capability, has been instrumental as a tool for flood mapping, damage assessment and control.
Exchange of services
Many of the collaborations derived through international cooperation are conducted on a no exchange of funds basis, and as such, barter agreements may be entered into where one service is given in return for another. For example, in exchange for Canadian access to NASA's icebridge mission which provides three-dimensional views of the Arctic and Antarctic ice sheets, ice shelves and sea ice, the CSA agreed to give NASA Nihka motor parts. In another instance, CSA astronauts received training in exchange for medical services provided to ESA astronauts by the CSA space medicine group. However, an important objective of 22% of the agreements signed is for the provision of operational services, often on a reimbursable basis, primarily to support Canadian activities with regard to the Astronaut program or to support tracking and telemetry activities of foreign missions. The principal partners for this are France and the U.S. Canada provides France's CNES with tracking and telemetry support through its stations, using its best reasonable efforts. The U.S. has provided crew support to Canadian astronauts for training of astronauts, utilizing the space shuttle, medical services or providing the ground support. Here Canada benefits from the infrastructure and the experience of NASA to support the Canadian astronaut program.
Support Canadian industry's participation in foreign missions
International cooperation gives the Canadian space sector an increased opportunity to export technology and expertise, while gaining new experience through collaboration. The need to secure access to foreign missions is critical to the development and growth of Canada's space industry because Canada cannot independently engage in the scale and magnitude of space projects that some international partners may be able to do (like ESA, NASA and JAXA). However, through foreign partnerships, the Canadian space sector can participate in such large-scale missions and generate substantial benefits from them.
The Canadian industry has developed new technologies such as Oscillator Units (Herschel Space Observatory mission) and is developing Laser Altimeters (OLA) to create 3D maps of asteroids (OSIRIS-Rex mission) for NASA. However, besides simple access to missions, wider benefits are expected. For instance, the Canadian technology that went into building OLA for the OSIRIS-Rex mission was partially based on laser and electronic technology developed for the Phoenix Mars mission that discovered snowfall on Mars, with this new mission giving Canada the opportunity to develop its novel techniques even further. With the new developments, it is expected to generate spin-offs, such as airborne lidar for terrestrial topographic mapping, resource management, visions systems for robotic mining and geomatics. Canadian participation to Argentina's Aquarius mission is another example of how Canadian industry players can leverage international cooperation and develop their technological capabilities. The mission and its benefits to the Canadian company INO are profiled below.
Case study #10 Canadian participation to Argentina's SAC-D/Acquarius mission
Canada ctribution to the SAC-D mission
- The SAC-D/Aquarius mission, led by the Argentina National Space Activities Commission (CONAE), was launched in 2011 and marked a significant step forward with a successful multi-agency collaboration (Italy, Brazil, France, U.S., and Canada).
- Canada initiated negotiations with Argentina and proposed that INO's infrared microbolometer detectors as Canada's contribution to the mission whose primary science objective was to collect oceanic and atmospheric measurements.
- INO is a private, non-profit technological design and development firm for optic and photonic solutions. It employs over 200 people in Quebec and Ontario. I
- Canada agreed to pay for the development costs of the detector, ($1.6 million) Argentina agreed to award a separate contract to INO for the development of the complementary New Infra-Red Sensor Technology (NIRST) camera ($1.5 million); resulting in two contracts for INO.
Benefits for Canadian cotributors
- The mission offered INO's first opportunity to get flight heritage for its product. Flight heritage is fundamental for development of an export business, as it is often a principal requirement of a foreign client. Opportunities to develop flight heritage in Canada are limited.
- Following successful launch of the Argentinian satellite in 2011, INO received follow on contracts from two foreign clients for $5 million; a direct result of the initial CSA investment towards the development of the technology. The same technology developed for Argentina has also been transferred to other companies for non-space general applications, resulting in royalties.
- In addition to benefits for INO, the mission helped Canada further diversify its scientific and national partnerships.
Opening up Canadian industry market opportunities
The development of new capabilities through international partnerships helped Canadian companies to boost visibility in the global market. This is particular true from Canadian participation in ESA programs where Canada is in the unique position of being the only non-European participant since 1979. As a Cooperating State, Canada participates in ESA deliberative bodies and decision making and takes part in programs and activities (e.g. telecommunications, earth observation, space exploration) under its cooperation agreement. Canadian firms can bid for and receive contracts to work on programs. For example, following CSA's $4.7 million investment in ESA ARTES satellite communication program between 1998 and 2008, COM DEV reported to have achieved $99 million in sales of the products developed under the program. The Canadian industry often praise ESA's flexible funding schemes, especially the ARTES program, which favours various forms of public-private-partnerships, including co-funding mechanisms, targeting commercially-oriented R&D programs.
The PolarView project is another typical example of the benefits derived by a Canadian firm from ESA contracts. It is detailed in the case study next page.
Case study #11 Polar view
The Polarview mission
- Polar View was a GMES Service Element project run by ESA targeting specific end-users to help promote and develop Earth observation services. Both Polar View and the preceding Northern View project consortiums were led by Canadian company C-CORE.
- The project focused on developing services to support research, northern communities, and business operations at northern latitudes. Services include, floe-edge mapping (the boundary between fixed and flowing sea/river ice), river and lake ice monitoring, and iceberg monitoring.
- ESA funded the project with €13 million over 2005-2012, plus a further €1.5 million aligned to Northern View. Over the same period, around €20 million was generated in extended contracts related to the study. At the time of the Polar View project completion in 2012, 90+ global end users (meteorology services, national ice services etc.) were involved from 17 countries.
- The consortium used more than 7000 image scenes annually to support its activity (60% SAR, mainly RADARSAT-1 and ASAR; and 40% optical).
- The involvement with ESA helped the company to refine its processes and provide a platform in order for services to be demonstrated. In addition, the CSA provided data (from RADARSAT-1, 6700 scenes) to support services development, and offer technical support.
- C-CORE has since (along with the other Polar View consortium members), incorporated the company Polar View Ltd. in the U.K. to further collaborate, offer services, and bid on further R&D contracts.
Benefits derived
- The total Canadian investment in GMES (including both Northern View and Polar View) was approximately $11 million and generated significant financial benefits. This investment resulted in approximately $17.5 million in non-GMES funding for Polar View, with $5.2 million for Canadian Polar View services and $12.3 million in for R&D activities related to these servicesFootnote 91.
- C-CORE is continuing to provide similar services generated through Polar View, and is now considered to be the global leader in the provision of ice-based services using Earth observation data. Returning end-users to services generated by the company through Polar View include Newfoundland, Yukon and Alberta provincial governments – with RADARSAT-2 data obtained through Public Safety Canada – as well as services to other northern countries sea-ice/meteorology services, particularly in Norway, Denmark and Finland.
- The services developed directly benefit northern communities in Canada and ensure safe-navigation of shipping. For instance being able to detect the floe-edge allows for the identification of transport corridors, and the provision of maps for navigation aids. Polar View services have had a significant, positive impact on aboriginal communities across the Arctic and their ability to secure traditional livelihoods and adapt to changing ice regimes.
- Other benefits reported include: increasing operations efficiency, improving the ability of user organizations to carry out their respective mandates and contributing to the formulation of an evolving European Arctic policy.Footnote 92
A distinctive aspect of ESA procurement is founded on the principle of industrial return or geo-return, which ensures that Member States contributions will be returned to each country in the form of contracts for ESA activities. In comparison to other Member States of ESA, Canada is receiving substantial benefits for its investment on the basis of this principle. The ESA industrial policy committee in assessing the geographical distribution of contracts between 2000 and 2008 concluded that contracts awarded to Canada achieved an overall return coefficient of 1.09.Footnote 93 As such, Canada is the second highest ranking of all 25 Member and Cooperating States after the Netherlands (which hosts ESA's largest facilities) in achieving the calculated return coefficient.
ESA had a budget of €3.45 billion in 2013, and Canada's contribution was €15.5 million (0.45% of the budget). Whereas commitments have seen Canada's contribution average at €20 million annually between 2008 and 2014, ESA funding has increased by 14% within that period, meaning that the Canadian contribution has generally declined as a percentage of the total ESA funding. The industry reports damaging effects from this situation in terms of access to this essential R&D program as well as of the reputation of Canada as a credible partner.
Conclusions
Canada enjoys a unique position in the global space sector. While not one of the world leaders, Canada is a historical pioneer in space and has always sought to generate maximum return from a moderate investment in its space program. This investment strategy has enabled the development of leading-edge, world-class, Canadian capabilities in selected niche areas such as robotics, sensors, scientific instruments and telecommunications payloads, placing Canada as a key international player and partner. However, as the global context for space activities is rapidly changing and Canadian investment in its space technological capabilities decreases, its position on the international scene is challenged.
With revenues of $5.37 billion in 2013, the Canadian space sector remains a small industry. Nonetheless it has demonstrated a strong vitality with:
- The ability to leverage initial government funding as shown by its share in the world space market (almost 2% in 2013) that largely exceeds the weight of Canada in global public expenditures for space activities (less than 1%).
- A dynamic downstream ecosystem thanks to investments made upstream in space technology that enable the necessary infrastructure to develop services and applications to end-users.
- Revenues growing at superior rates to the Canadian economy (3.7% on average during the last five years compared to 1.8%).
- Jobs growing six times faster than Canada's national market in the last five years.
This vitality diffuses benefits across Canada's economy. Taking into account its direct, indirect and induced effects, the Canadian space sector generated:
- An economic multiplier of 1.85 with a total GDP contribution of $2.9 billion. Services and manufacturing are the biggest contributors accounting respectively for 55% and 30% of this figure.
- An employment multiplier of 2.5, with 24,354 full-time equivalent jobs essentially composed of highly-qualified and highly productive personnel.
- $750 million of tax revenues to federal, provincial and municipal governments.
While methodologies for calculating economic benefits can diverge between studies, it was found that the Canadian space sector's multipliers are equivalent, if not superior to, other sectors such as aviation or aerospace in Canada, or the space sector in the UK which has recently undertaken a similar assessment.
Canada realized early on the significant benefits it could derive from the development and use of space technology. Since the launch of the first Canadian space mission more than 60 years ago, advanced technologies and space-based solutions have translated into innovations, knowledge creation and services delivered to a large range of national stakeholders. The range of these benefits have been portrayed in this study including the R&D intensive nature of the space sector, the spillover effects from CSA contracts and the dynamism of the Canadian space research and scientific communities. It is also demonstrated by the diversity of the services supplied to government and private end-users who rely on space-based solutions to manage their business operations in a cost-efficient way.
Beyond its economic impact, the Canadian space sector has a high strategic and social value that is no less important. The Canadian space program has been increasingly devoted to matching government priorities as illustrated by the missions launched or under development, and as confirmed with the Space Policy Framework adopted in 2014. This positioning helps to fully integrate the Canadian space sector into the national civil and defence communities, to expand the usage of space-based solutions within government and to maximize their benefits.
- Space is a key enabler for the Canadian military. Space-based assets are increasingly enabling DND to undertake its core missions including ensuring maritime domain awareness, exercising Arctic sovereignty and conducting international operations.
- Space is essential to support the monitoring and protection of the global and Canadian environment. Considering the size of the Canadian land mass, its ecological diversity and the extent of its national resources, the benefits generated by the usage of space-based information are immense for the country.
- Space has become part of Canadians' everyday lives. Whether related to quality of life, personal safety, entertainment or essential connectivity, space is a major part of Canada's backbone of services to citizens.
- Space has also contributed to raising the country's position on the international scene. From large multilateral cooperation such as the ISS, to more modest bilateral projects, the international nature of space generates benefits for government organizations and industry players involved in cooperation programs. International cooperation in space activities, enables Canada to undertake activities that it would not be able to do alone or only at a significantly higher cost.
Nevertheless, the Canadian space sector also faces key challenges, several of which have remained unchanged for years. The following are considered the most critical:
- As the global context for space activities is rapidly changing and Canadian investment in its space technological capabilities decreases, its position on the international scene is challenged. Although a G7 country, Canada dedicates much less of its GDP to its civil space activities than the world average. Its baseline funding will likely not enable Canada to maintain its space capabilities in the long term. In addition, budget instability and unpredictability affects the most fragile players, especially SMEs that form a critical part the Canadian space sector's ecosystem.
- When taking into account defence, the Canadian government's total investment in space has actually increased quite significantly. However, the return of these investments remains limited for the Canadian space sector as a large part is spent on foreign programs. Considering the scale of the investments, this is a non-negligible shortfall for the Canadian space sector.
- Canadian government investment in space has not always supported domains showing high market potential, limiting the possibility to turn this initial investment into larger economic gains for the space sector. As result, several industry players have been progressively pushed away from the Canadian space program. In addition, this situation fosters at the same time dependency for a segment of the industry on government-specific requirements and cycles of decisions and investments.
- Many successful companies focus on the export market which can represent up to 90% of their revenues, with little dependency on government R&D or support programs. While a sign of commercial maturity, in the longer term it could create a risk for business sustainability and key technological capabilities and furthermore cause a disconnect between industry technological capabilities and government national requirements.
- The Canadian industry has made significant investments outside Canada, including foreign acquisitions and the implementation of facilities in other countries. While it shows the dynamism of the largest Canadian companies, they choose to invest outside Canada to grow their business. Conversely, Canada does not attract enough foreign investment in its space sector, whereas this would provide additional capital and grow its technology base.
- Outside a few large programs, Canada offers limited opportunities to undertake programs in partnership between the public and the private sectors. Whether for R&D or the delivery of operational services, large to small scale projects, many countries have implemented a larger portfolio of cooperation schemes allowing the flexible implementation of programs and expanding funding sources.
- Finally, only a healthy indigenous space industry can generate the benefits that Canada can expect to accrue in the future from its space investments and, more generally from space activities whether these activities are based on Canadian or foreign space assets.
This report does not aim to formulate recommendations, but several elements could be considered to increase the impact of the Canadian space sector, including:
- The review of mechanisms used in other sectors or in other countries, and the assessment of their implementation in Canada. Whether for investment strategies, partnerships, co-funding mechanisms, technology transfers, regulations, support to start-ups or SMEs, interesting lessons learned could be collected and shared from their experience.
- Based on the 2014 Space Policy Framework, the definition of a national strategy for space technology and industry associating all components of the Canadian space program (civil and defence, industry and scientific communities). Such a national strategy, outlining a long-term action plan related to strategic capabilities, would be key to ensuring the sustainable long-term impact of the national space sector for Canada.
Acronyms
- AAFC Agriculture and Agri-Food Canada
- AEHF Advanced Extremely High Frequency (satellite)
- AER Alberta Energy Regulator
- AETD Advanced Exploration Technology Development )
- AIS Automatic Identification System
- AIT Assembly, integration and test
- ARGOS Advanced Research and Global Observation Satellite
- ARTES Advanced Research in Telecommunications Systems
- ASAR Advanced Synthetic Aperture Radar
- ATM Automated teller machine
- CAF Canadian Armed Forces
- CAGR Compound annual growth rate
- CANSpOC Canadian Space Operations Centre
- CBC Canadian Broadcasting Corporation
- CCRS Canadian Centre for Remote Sensing
- CFDS Canada First Defence Strategy
- CFIOG Canadian Armed Forces Information Operations Group
- CFI Canadian Foundation for Innovation
- CIS Canadian Ice Services
- CNES Centre National d'Études Spatiales
- CSA Canadian Space Agency
- DARPA Defense Advanced Research Projects Agency (U.S.)
- DFO (FOC)Fisheries and Oceans Canada
- DMGCS Deputy Minister Governance Committee for Space
- DND Department of Defence
- DRDC Defence Research and Development Canada
- DTH Direct-to-home
- EBITDA Earnings before interest, taxes, depreciation and amortization
- EC Environment Canada
- ECV Essential climate variables
- EO Earth observation
- ESA European Space Agency
- ERP Enterprise resource planning
- EUMETSAT European Organisation for the Exploitation of Meteorological Satellites
- FSS Fixed satellite services
- FTE Full-time equivalent (jobs)
- GDP Gross domestic Product
- GEO Geostationary
- GEOINT Geospatial intelligence
- GHz Gigahertz
- GMES Global Monitoring for Environment and Security
- GNSS Global Navigation Satellite System
- GOSAT Greenhouse gases Observing Satellite
- GPS Global Positioning System
- HQP Highly qualified personnel
- IMINT Imagery intelligence
- ISP Internet service provider
- ISR Intelligence, surveillance, reconnaissance
- ISS International Space Station
- ISTOP Integrated Tracking of Pollution Program
- JAXA Japan Aerospace Exploration Agency
- JPL Jet Propulsion Laboratory
- JSSP Joint Space Support Project
- LBS Location based services
- LDRS Low Data Rate Service
- LEO Low earth orbit
- M2M Machine-to-machine
- M3MSat Maritime Monitoring and Messaging Micro-Satellite
- Mbps Megabits per second
- MCTS Marine Communications and Traffic Services
- MENA Middle-East and North Africa
- MEO Medium earth orbit
- MHz Megahertz
- MSC Meteorology Services Canada
- MSS Mobile satellite services
- NAICS North American Industry Classification System
- NATO North Atlantic Treaty Organization
- NAVWAR Navigation Warfare
- NASA National Aeronautics and Space Administration
- NEOSSat Near-Earth Object Surveillance Satellite
- NMSO National Master Standing Offer
- NOAA National Oceanic and Atmospheric Administration
- NORAD North American Aerospace Defense Command
- NPOESS National Polar-orbiting Operational Environmental Satellite System
- NRCan Natural Resources Canada
- NSERC Natural Sciences and Engineering Research Council of Canada
- NWT Northwest Territories
- OECD Organisation for Economic Cooperation and Development
- OEM Original equipment manufacturer
- OGD Other government department
- PND Personal navigation device
- R&D Research and development
- RCM RADARSAT Constellation Mission
- RSO Resident space object(s)
- SATNAV Satellite navigation
- SAR Synthetic aperture radar
- SATCOM Satellite communications
- SBAS Satellite-based augmentation systems
- SME Small-medium enterprise
- SOLAS Safety of Life at Sea
- SRMS Shuttle Remote Manipulator System
- SSOC Sensor System Operations Centre
- ST&I Science Technology and Innovation
- STDP Space Technologies Development Program
- TC Transport Canada
- UAV Un-manned aerial vehicle
- VAAC Volcanic Ash Advisory Centres
- VSAT Very-small aperture terminal
- WGS Wideband Global SATCOM
- WMO World Meteorological Organization
List of interviews
Government
- CSA, Policy Development - Dean Flett, Senior Adviser.
- CSA, Policy Development - Thomas Davis, Advisor Science and Technology.
- CSA, Communications - Anna Kapiniari, Director Communications & Public Affairs.
- CSA, Audit &Evaluation - Vanessa Anastasopoulous, Team Leader.
- CSA, Space Utilization - Martin Herbert, Applications and Utilizations.
- CSA, Policy Implementation - Lauren Small, Manager International Relations.
- CSA, Intellectual Property Office – Nancy Gardner, Head Intellectual Property and Technology Transfer Services.
- CSA, Space Science and Technology – Myriam Dube, Head ESA Programs.
- CSA, Space Science and Technology – Jean-Claude Piedboeuf, DG Space Science and Technology
- CSA, Space Exploration - Érick Dupuis, Director Space Exploration Development.
- Department of Defence - B Gen Lalumière, Director General Space.
- Parks Canada - Brocks Fraser, National Geomatics Coordinator.
- Federal GNSS Coordination Office - Jina MacEachern, Head.
- Industry Canada, Aerospace Marine and Defence - Phillipe Richer, Director Research.
- Public Health Agency of Canada - Pascal Michel, Director
- Fisheries and Oceans Canada - Jim Gower, Research Scientist.
- Natural Resources Canada, Canada Centre for Remote Sensing – Vern Singhroy, Senior Research Scientist.
- Alberta Geological Survey – Todd Shipman, Manager Landscapes & Geological Hazards,
- Agriculture Canada, Center for Agro Climate, Geomatics & Earth Observation – Andrew Davidson, Manager Earth Observation.
- Department of Foreign Affairs, Trade and Development - Thomas Gillon, Remote Sensing Space Systems Regulation and Senior Scientific Advisor.
Private sector
- Telesat - Jack Rigley, Director New Satellite Systems Development.
- Explorenet - Tim Dinesen, EVP-Network.
- Bell TV - Borika Vucinic, Director Broadcast and Engineering Ops.
- Shaw Direct - Paul Tilley, Director - Strategic Sourcing Networks and Satellite.
- Effigis - Pierre Vincent, EVP.
- ABB - Jacques Giroux, Business Development Manager.
- MDA GSI - Dave Belton, VP.
- MDA – Paul Cooper, VP, Strategic Development.
- Infosat - Ron Parkinson, Director Sales.
- Novatel - Steve Duncombe, Sales.
- Magellan - Ken Kohut, Marketing Manager.
- Comdev – John Stuart, VP Business Development
- Comdev - Sid Rao, Business Development Manager.
- C-CORE - Tom Puestow, Project Manager, Polar View.
- Blackbridge - Scott Soenen, CTO.
- Suncor - Ken McLaughlin, Program Manager.
- Neptec Technologies - Brad Jones, Director.
- INO - François Châteauneuf, Program Manager Environment.
Universities
- Ecole Polytechnique de Montreal – Annie Martin, PhD canadidate.
- HEC Montreal - Patrick Cohendet, Professor.
- Centech ETS - Robert Dumontet, Director
- Dalhousie University - Randall Martin, Professor.
Methodology note
The measurement of the Canadian Space Sector's economic impacts is a challenging task as there is no single industrial classification for space activities in Canada (and in other countries). Companies participating in the space sector's value chain are also active in a wide assortment of activities and are therefore generally classified within the statistical industry accounts of a range of sectors. For example, while MDA, Telesat or Shaw form part of Canada's space sector, their respective activities (manufacturing/engineering, satellite operations and TV broadcasting) diverge in terms of industrial classification and subsequent economic linkages. Furthermore, space-related activity as a percentage of total firm activity can vary greatly between firms and industrial sectors, limiting the possibility to directly extract or aggregate information from national industrial accounts data.
The CSA's annual survey of the Canadian space sector gathers primary data related to firms' space activities and serves as the foundation for our assessment of the sector's overall economic footprint. To help reconcile the issue of disparate industrial classifications and to quantify the overall economic impacts of the space sector, the CSA, in partnership with Industry Canada, began the task of mapping Canadian companies involved in space activities based on the North American Industry Classification System (NAICS), leveraging specialized data from Canada's Business Register. This exercise, first performed using 2012 CSA survey results, generated a list of over 10 separate industrial classifications, which were then grouped into four larger segments based on each firm's value-chain activities, including Engineering & Consulting Services, Manufacturing, Satellite Operations and Value-added Service Providers.
Customized economic multipliers were then built for each value chain segment based on the respective weightings of firm level employment within each category's underlying industrial NAICS codes using Statistics Canada's input-output accounts. Using this jointly developed economic model, estimates of direct, indirect and induced impacts on Canada's GDP were derived for each space sector segment.
For the purposes of this study, the core methodology remained the same, while multipliers were updated and refined using 2013 survey data and inputs from industry consultations in concert with both the CSA and Industry Canada. Two types of primary inputs can be used in an input-output model: turnover or employment. While turnover has been used as the primary input by some economic impact studies undertaken by third parties, employment has been chosen here as it provides a more accurate portrait of the true level of economic activity being performed within Canada's borders. Direct employment levels were gathered directly from annual survey, while the customized economic multipliers were used to estimate the space sector's indirect and induced effects on employment in Canada. It is important to note that the economic multipliers were adjusted to account for supply-chain linkages (thus avoiding double-counting) within the space sector itself, as multiple companies supply each other with intermediate goods and services which would otherwise lead to an overestimate of the sector's indirect effects.
In terms of contribution to government revenues, corporate taxation data is not gathered by the CSA's annual survey and due to the cross-industry nature of the space sector, reliable estimates cannot be derived from results of the customized input-output model. However, the analysis of the publically available financial statements of firms generating primary space revenues provides some insight into direct corporate taxation levels. Estimates of wages (personal income) supported by the Canadian space sector were derived through analysis of average salaries for each of the retained industry classifications (NAICS) and their corresponding salary levels, as provided by Statistics Canada. Income taxes were then estimated based on the corresponding provincial and federal tax rates, in line with the provincial distribution of space sector employment. Estimates of indirect taxation, which includes sales tax on intermediate goods, excise, property taxes and others were adapted from the customized input-output multipliers.